
Most companies run more than one monitoring or observability system: cloud and on-premises, open-source and commercial, metrics, logs, and traces. Each system has a different user experience, permissions are hard to manage, and technical leaders often struggle to unify the stack while still empowering each team.

Replacing everything from scratch is usually unrealistic. Migration cost is high, and nobody can guarantee that a so-called all-in-one system will beat the existing tools in every area. A better path may be to reuse what already works while improving the experience and value on top.
Grafana is a good example. It has almost unified data visualization. If we go one step further, what else can be unified besides visualization? The answer should be alerting. A typical monitoring and observability architecture looks like this:

Data collection is naturally diverse: metrics use Categraf and exporters, tracing uses OpenTelemetry Collector, and logs use Filebeat. There is not much need to force unification here.
Data storage is also mostly settled: metrics often use VictoriaMetrics or Prometheus, while logs and tracing often use ElasticSearch or ClickHouse.
Alerting still has room for unification. First, we want alerts from different platforms to come together. Then we want unified noise reduction, scheduling, acknowledgement, escalation, and flexible dispatch. We built Flashduty for unified alerting. This article introduces some of its design ideas.
Flashduty's Approach to Unified Alerting
Unified alerting can be split into two areas: unified event generation and unified event distribution.
- Event generation is usually handled by monitoring systems. Users configure alert rules; the monitoring system periodically queries storage, evaluates data, and generates alert events.
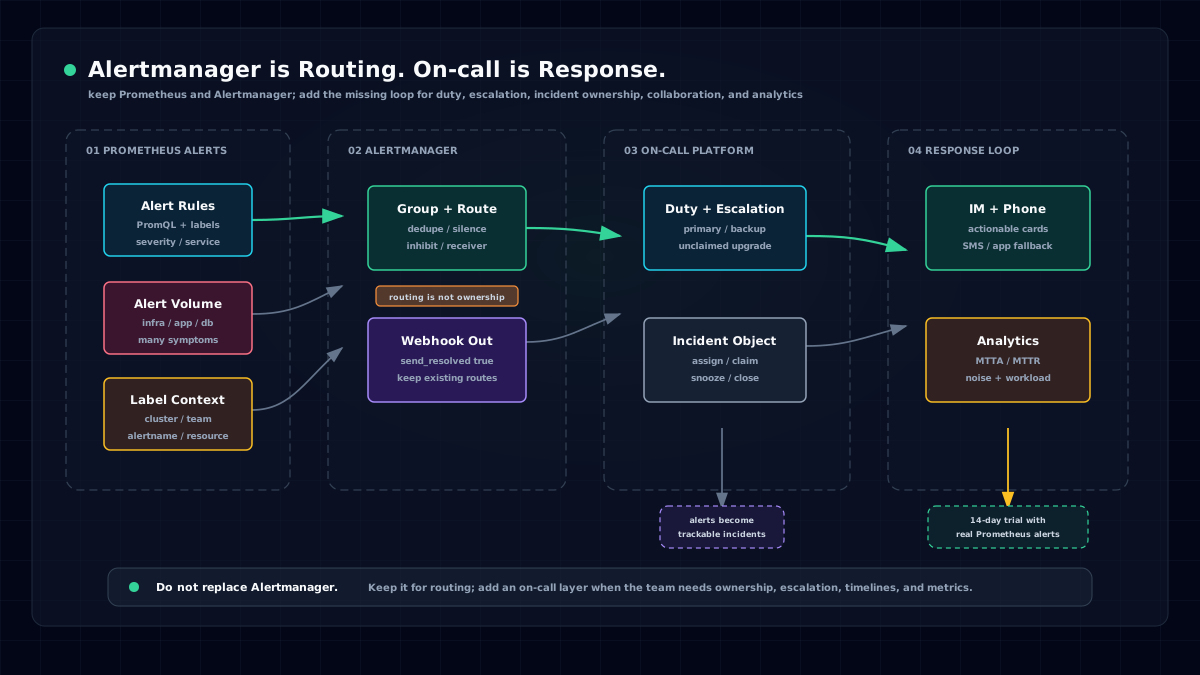
- Event distribution is usually handled by an On-call platform such as PagerDuty or Opsgenie. It integrates with monitoring systems, collects alert events, and provides noise reduction, scheduling, and dispatch.
Unified Event Generation
Flashduty can connect to many storage systems, including Prometheus, VictoriaMetrics, Thanos, MySQL, Postgres, Oracle, ElasticSearch, Loki, and ClickHouse. Users can configure query-based alert rules, and Flashduty periodically queries those sources to generate alert events.
The architecture looks like this:

A company usually has multiple data centers, and each data center may have different storage systems. To alert on those systems, we recommend deploying one alert engine in each data center to avoid network-partition problems. The alert engine synchronizes rules from the central service, queries local storage, evaluates abnormal data, and generates alert events.
Here is an example alert rule list page, where teams can manage different types of alert rules in Flashduty:

In addition to generating alert events from storage queries, Flashduty provides a small event-monitoring tool called catpaw. catpaw can run custom scripts, check the problem site, and generate alert events directly when it detects issues. catpaw is open source: https://github.com/cprobe/catpaw.
Unified Event Distribution
When alert events are scattered across monitoring systems, they are hard to process, hard to measure, and prone to alert storms. This is where an On-call platform is needed.
Products such as PagerDuty and Opsgenie address this market overseas. PagerDuty has reached a multi-billion-dollar valuation. Some SREs will refuse to join an employer if they find that the company does not use PagerDuty, because On-call without a proper tool is painful: one alert at 3 a.m. can wake up the entire team.
Flashduty is similar to PagerDuty. It integrates with many monitoring systems and collects alert events. The currently supported integrations include:

The data flow is simple: monitoring systems generate alert events and send them to Flashduty through Webhook or Email. Flashduty then handles the events uniformly:
- Label enrichment: attach meaningful metadata to alert events for filtering, viewing, and correlation.
- Event processing: modify alert events by condition, or filter and suppress them.
- Routing: route events by attributes and labels into specific workspaces, which usually means specific teams.
- Dispatch: inside a workspace, different dispatch policies can use different notification channels for different severities.
- Dispatch can use schedules so the whole team is not interrupted.
- Acknowledgement and escalation policies ensure alerts are eventually handled.
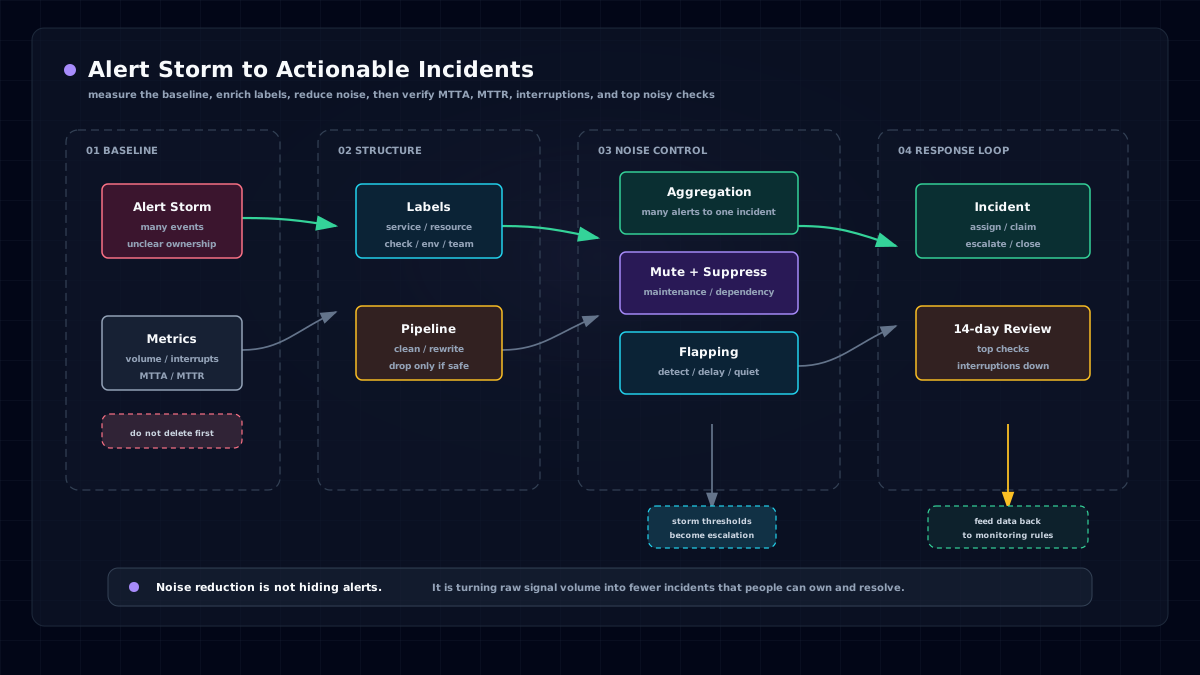
- Noise reduction can merge multiple alerts into incidents to handle alert storms.
- IM integrations make mobile response practical, especially when responders are half-asleep at night.
Summary
By unifying event generation and event distribution, Flashduty improves the overall alerting experience. The new architecture becomes:

If you want to build a similar platform, you can refer to Flashduty's approach or use Flashduty directly:
- Product: flashcat.cloud/product/flashduty/
- Free signup: console.flashcat.cloud