
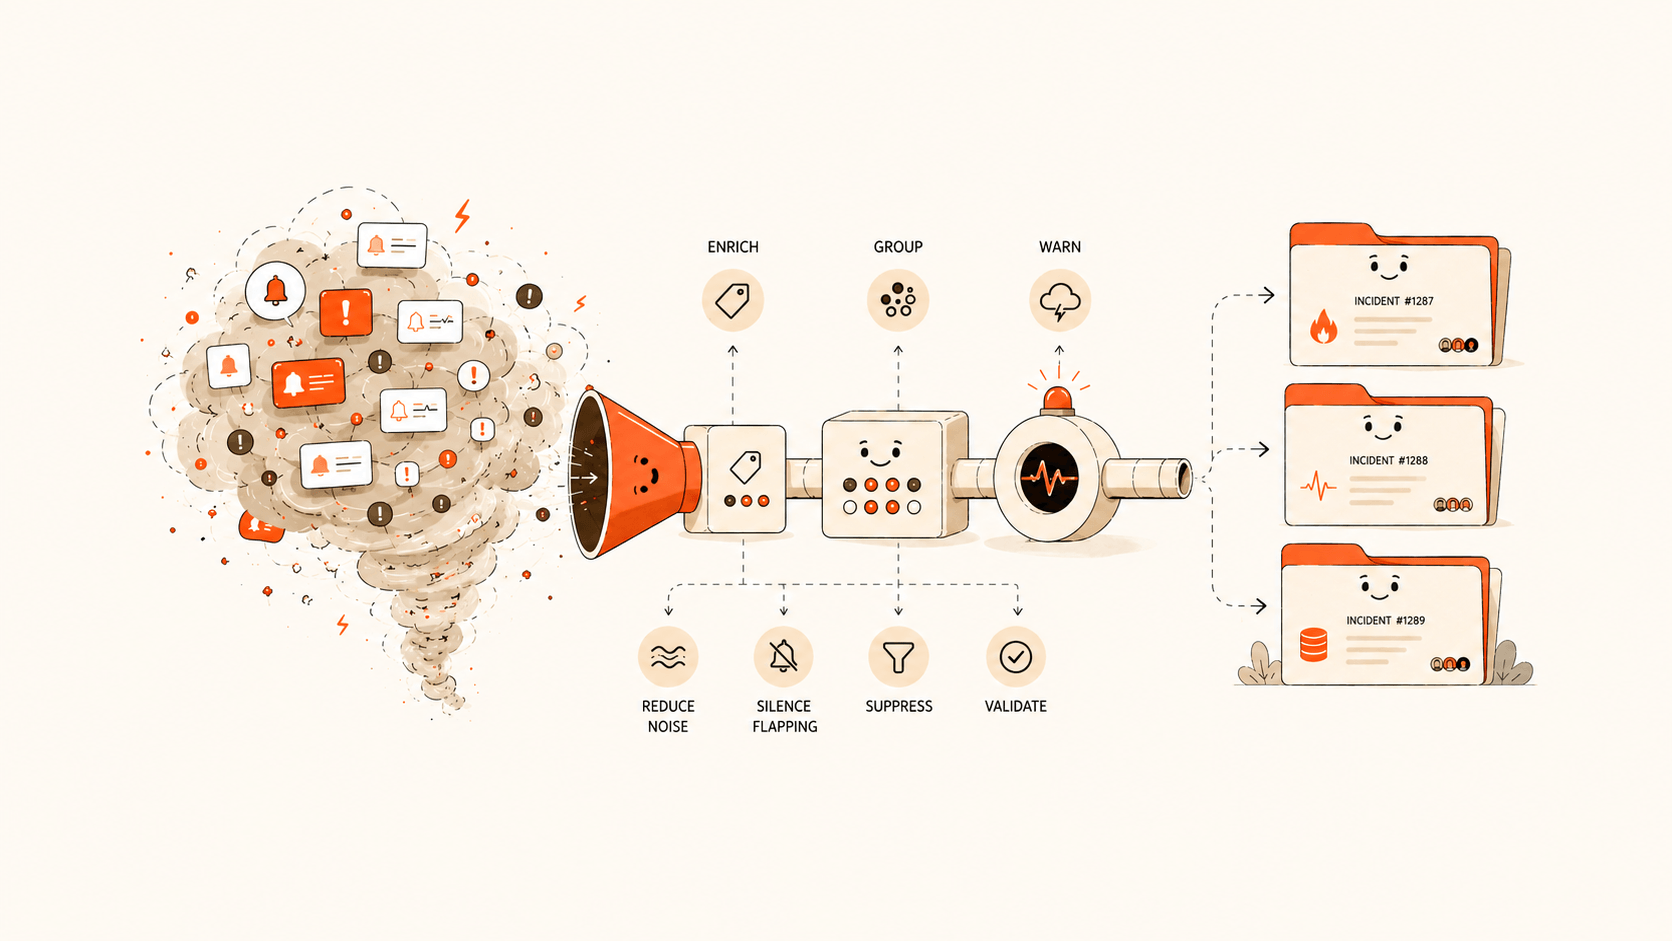
The goal of noise reduction is to converge a flood of alerts into a few incidents you can act on. If one server outage triggers 100 alerts, your on-call engineer should handle it once. You don't need to delete monitoring rules first. Instead, complete labels and turn on grouping in the response layer, then add silences, suppression, and flapping detection. After 14 days, check the result against incident count and night-time interruptions.
This post walks through the plan day by day and ends with a configuration template you can reuse. For parameter ranges, see the Flashduty noise reduction docs.
The 14-day plan
Pick one noisy collaboration space and work through these stages:
| Days | Action | What to watch |
|---|---|---|
| 1–2 | Ingest real alerts without changing rules | Incident count, top alerts, sleep-time interruptions, MTTA, MTTR, and response rate |
| 3–5 | Complete labels: service, resource, check, env, and team | Whether labels are stable and usable |
| 6–8 | Turn on grouping for the noisiest 5–10 alert types | Whether duplicates join the same incident |
| 9–10 | Configure silences and flapping detection | Whether maintenance windows and self-healing alerts leave strong notification paths |
| 11–12 | Configure suppression and storm warnings | Whether derived alerts are held back and large incidents get a second alert |
| 13–14 | Compare against the baseline | See the acceptance criteria at the end |
Alert storms start in the response layer. Monitoring systems push many events to people. The response system doesn't organize them into incidents, so responders can't judge, dispatch, acknowledge, or escalate them.
Don't start by deleting rules
Many teams hear "noise reduction" and go straight to the monitoring system. They delete rules, raise thresholds, or turn off low-severity alerts. That's sometimes necessary, but it shouldn't be the first step.
Deleting rules is risky. Delete too many and you can miss early signals. Set thresholds too coarsely and they fire only after users are affected. Turn off every Warning and it's quiet for a while, but you lose early warnings about capacity, performance, and dependencies.
A safer approach is to catch alerts in the response layer first, then converge, dispatch, and measure them. After that, go back to the monitoring side and fix the rules that are actually broken.
Separate events, alerts, and incidents
The Flashduty model looks like this:
Monitoring system → Event → Alert → Incident- Event: a raw notification from a monitoring system. A trigger, a recovery, or an update is each an event.
- Alert: created by events. The trigger, update, and recovery events of one alert all merge into that alert.
- Incident: the thing your team handles. Similar alerts group into one incident, which is dispatched, notified, acknowledged, escalated, and closed as a unit.
Without noise reduction, one alert often maps to one incident, and responders face many separate incidents. With noise reduction, similar alerts join one incident. Responders handle one problem instead of a stream of notifications.
Record a baseline before you change anything
Before you reduce noise, look at real alert data:
- How many incidents did you have last week?
- What share is Critical, Warning, and Info?
- Which alert checks and alert objects fire most?
- Which notifications arrive during sleep hours?
- Which alerts are never acknowledged?
- Which incidents absorb many alerts?
- Which services trigger and then recover quickly?
Flashduty analytics shows incident data by team, collaboration space, person, and other dimensions. Metrics include incident count, MTTA, MTTR, response rate, response effort, and interruption count. You can split time into work, rest, and sleep periods. Global views show the top 20 alert checks and alert objects.
Don't chase a compression ratio yet. Record four baselines first:
Raw alert volume: how many events and alerts monitoring systems pushed
Incident count: how many incidents Flashduty created that need handling
Notification interruptions: how many interruptions SMS, voice, and app push caused
Response efficiency: whether MTTA, MTTR, and response rate are reasonable
Recheck these four after every policy change. Otherwise it's easy to mistake "fewer notifications" for "better governance."
Stable labels decide how well noise reduction works
Grouping, routing, silences, and suppression all depend on labels. If an alert has only a title and description, those rules can't work reliably. You need at least these stable labels:
| Label | Meaning | Main use |
|---|---|---|
service | Business service or application | Route to the right collaboration space |
resource | Alert object, such as a host, instance, Pod, or database | Group alerts for the same object |
check | Alert check, such as CPU, disk, or API error rate | Top alert checks in analytics |
env | Environment, such as production or staging | Separate production from test |
team | Owning team | Dispatch policies and ownership |
cluster or region | Cluster, data center, or region | Data-center-level suppression and grouping |
Flashduty label enrichment creates or changes labels as alerts arrive. You can extract values with regex from titles, descriptions, or existing labels, or combine labels into new ones. Mapping tables turn IDs into readable values, and you can drop labels you don't need. For advanced cases, API mapping queries external systems to add team, service tier, and similar data.
If labels aren't stable, noise-reduction rules are hard to maintain. Standardizing upstream alert fields usually beats writing 10 complex regexes.
Drop events with no value at the integration layer
Some events shouldn't enter the response path. Examples are restart alerts from dev environments, known harmless errors, and expected errors from load tests. Once they reach a collaboration space, they consume routing, grouping, and analytics resources, and they cloud governance decisions.
The Flashduty alert processing Pipeline runs at the integration layer. It runs after label enrichment and before routing. Common uses:
- Change severity: raise a payment service's Warning to Critical so it triggers stronger notifications.
- Rewrite the title or description: turn machine-generated titles into business language, or append runbook and dashboard links.
- Drop alerts: discard events with clearly no value before they're stored.
- Suppress at the integration layer: handle global dependencies within one integration.
Recovery events (event_status=Ok) skip the Pipeline and go straight to alert merging. Don't design flows that assume the Pipeline can drop, rewrite, or suppress recovery events.
Pipeline rules apply to every alert from that integration, regardless of which collaboration space it routes to. Keep only rules with clear global agreement at the integration layer. Put team-specific policies in the collaboration space.
Group many alerts into one incident
Grouping is the main tool against alert storms. It doesn't hide alerts. When similar alerts join one incident, the responder handles one incident and can still see the related alerts and raw events in its details.
Flashduty supports two grouping modes:
- Intelligent grouping: good for a quick start. It computes similarity from
title,description,labels.service,labels.resource, and other fields, and you can adjust which fields count. - Rule-based grouping: good when you need exact boundaries. Alerts group only when the specified attributes or labels are identical. You can use one set of dimensions, or match conditions and use different dimensions per alert type.
Both modes cap the number of fields and branches; see the grouping limits. Here's a practical starting point:
Infrastructure alerts: group by labels.resource + labels.check
Application alerts: group by labels.service + labels.check + labels.env
Kubernetes alerts: group by labels.cluster + labels.namespace + labels.workload
Database alerts: group by labels.service + labels.resource + labels.check
If your labels are still incomplete, start with intelligent grouping to cut noise quickly. If the risk of grouping the wrong alerts is high, switch to rule-based grouping.
Set the grouping window with care. With the window off, new alerts keep joining the open incident until it closes. With the window on, alerts that arrive after the window create a new incident. The window can start when the incident triggers or when an alert joins it. The second option restarts the window on every join, which suits storms where alerts keep pouring in.
Escalate incidents that stay serious after grouping
Grouping cuts duplicate notifications, but a grouped incident can still be serious. An incident that keeps absorbing alerts often means the impact is spreading.
Flashduty storm warnings cover this case. When the number of grouped alerts reaches a threshold, the system logs a storm event on the incident timeline and sends a warning. Use storm warnings as a second escalation signal. For example:
- At 20 grouped alerts, remind the current responder to confirm impact.
- At 100 grouped alerts, escalate to the team lead.
- At 500 grouped alerts, start the major-incident process.
Don't copy these thresholds as is. Infrastructure, application, Kubernetes, and cloud alerts have different densities. Look at how many alerts similar incidents absorbed over the past two weeks, then set thresholds.
Handle flapping with flapping detection and delay windows
Brief network blips, occasional API timeouts, nodes near their limits, and unstable collection all cause flapping. The same incident triggers and recovers again and again. Each round looks like a new problem, which drains responders.
Flashduty flapping detection marks incidents that trigger and recover too often as flapping. It's on by default for new collaboration spaces, in notify-only mode. By default, four state changes within 60 minutes count as flapping. In notify-then-silence mode, the default silence lasts 120 minutes.
Start with notify-only and watch which alerts get marked as flapping. Once you confirm they're short-lived blips, turn on notify-then-silence for those types. Silencing all flapping on day one can hide an incident that keeps getting worse.
Delay windows in dispatch policies help too. A delay window waits before the first notification. If the incident closes during the wait, no notification goes out. For self-healing timeouts and transient blips, a short delay beats an immediate phone call.
Use silences for maintenance windows and known issues
Silences fit alerts that are expected and don't need a notification for now. Typical cases are planned maintenance, batch releases, load tests, and data migrations. Hardware swaps, scheduled restarts, and fix windows for known issues also qualify.
Flashduty supports one-time silences, recurring silences, and silences based on service calendars. Conditions can match severity, title, description, integration source, and labels, with AND/OR logic. A matched alert can be dropped, or kept and marked as silenced.
Prefer keep-and-mark. Dropping is quieter, but you have less to go on when troubleshooting. With keep-and-mark, you can see what a silence rule matched and check in a review whether its scope was too broad.
Responders can also choose More actions → Quick silence in incident details to create a temporary rule. The rule lasts one day by default and is deleted when it expires. Repeating the action on the same incident edits the existing rule instead of creating duplicates.
Always set an expiry on silences. A temporary issue shouldn't turn into a permanent rule.
Use suppression for root causes and derived alerts
When a data center's network fails, downstream hosts, databases, applications, and APIs all alert. The data-center network is what needs attention first. The rest are derived alerts. If you push them all to people, the root cause gets harder to see.
Flashduty suppression automatically holds back related secondary alerts while a root-cause alert exists. A typical example: while a Critical incident exists, suppress Warning and Info for the same check. A suppression rule has three parts:
- New alert conditions: which alerts get suppressed, such as Warning and Info.
- Active alert conditions: which alerts act as the source, such as Critical.
- Equal fields: attributes or labels that must match on both, such as check or hostname.
Suppression requires a matching active alert within 10 minutes. For how active alerts are defined, see the suppression docs.
You can configure suppression in a collaboration space or at the integration layer. Pipeline suppression at the integration layer matches only active alerts in the same integration, so it suits global logic. For example, after a data center loses network, suppress all alerts from that data center. Suppression in a collaboration space matches all active alerts in that space, so it suits a team's own dependencies.
Suppression has to state the source alert, the target alert, and the dimensions they share. That's safer than silencing every Warning.
Match the tool to the case, and drop only as a last resort
Exclusion rules in a collaboration space and Pipeline drops both discard events before storage and keep no record. Silences and suppression still work at the alert layer; matched alerts just don't notify. With keep-and-mark, you can still find them in the alert list later.
Use each tool for its case:
| Case | Tool |
|---|---|
| Events with clearly no value that don't need auditing | Exclusion rule or Pipeline drop |
| Maintenance windows and known issues | Silence |
| Derived alerts while a root cause exists | Suppression |
| Similar alerts arriving together | Grouping |
| Repeated trigger and recovery | Flapping detection and delay window |
Dropping is the last resort. Quiet isn't the same as reliable.
A reusable noise-reduction template
Start with this minimal template:
Label enrichment:
- Extract service, resource, check, env, team
- Use mapping tables to complete team or service_name

Pipeline:
- Discard no-value alerts from dev/test environments
- Rewrite titles while preserving service, resource, check, and env
- Upgrade specific Warning alerts from core services to Critical

Grouping:
- Infrastructure: resource + check
- Application service: service + check + env
- Database: service + resource + check

Flapping detection:
- Start with notify-only mode
- Enable notify-then-silence for confirmed self-healing short flaps

Silence:
- Use one-time silence for maintenance windows
- Use recurring silence for scheduled tasks
- Prefer keep-and-mark instead of no-record discard

Suppression:
- When Critical exists, suppress Warning/Info under the same service/resource/check
- Handle data-center or cluster-level failures at the integration layer

Storm warning:
- Configure 2 to 3 thresholds for high-frequency incidents
- Enter escalation or major-incident flow when thresholds are reached

Validation:
- Weekly review incident count, interruption count, MTTA, MTTR, response rate, and alert top lists
The template is a starting point. Teams differ in monitoring sources, label quality, service boundaries, and on-call practice. Effective policies have to come from your real alert data.
Check the result against your baseline
On days 13 and 14, compare against the baseline:
- Did incident count drop?
- Did interruptions drop, especially during sleep hours?
- Did MTTA for Critical alerts hold steady or improve?
- Did Warning and Info alerts leave strong notification paths?
- Are the top 20 alert checks concentrated in a few rules?
- Is it easier for responders to tell which incident to work on?
Read the results this way:
- Fewer notifications but a longer Critical MTTA: you've reduced too much.
- Fewer incidents but top alerts still concentrated in a few checks: go back and fix those rules in monitoring.
- Fewer interruptions, no worse MTTA and MTTR, and faster diagnosis: noise reduction is starting to pay off.
Flashduty doesn't replace your monitoring systems. It adds a response layer after Prometheus, Zabbix, Nightingale, Grafana, cloud monitoring, and internal systems. Monitoring detects problems, and Flashduty turns them into incidents you can act on while cutting unnecessary interruptions.
To start your 14-day experiment, sign in to the Flashduty console and create a collaboration space.