
Now

Featured

Why DeepSeek moved its status page from Atlassian to Flashduty

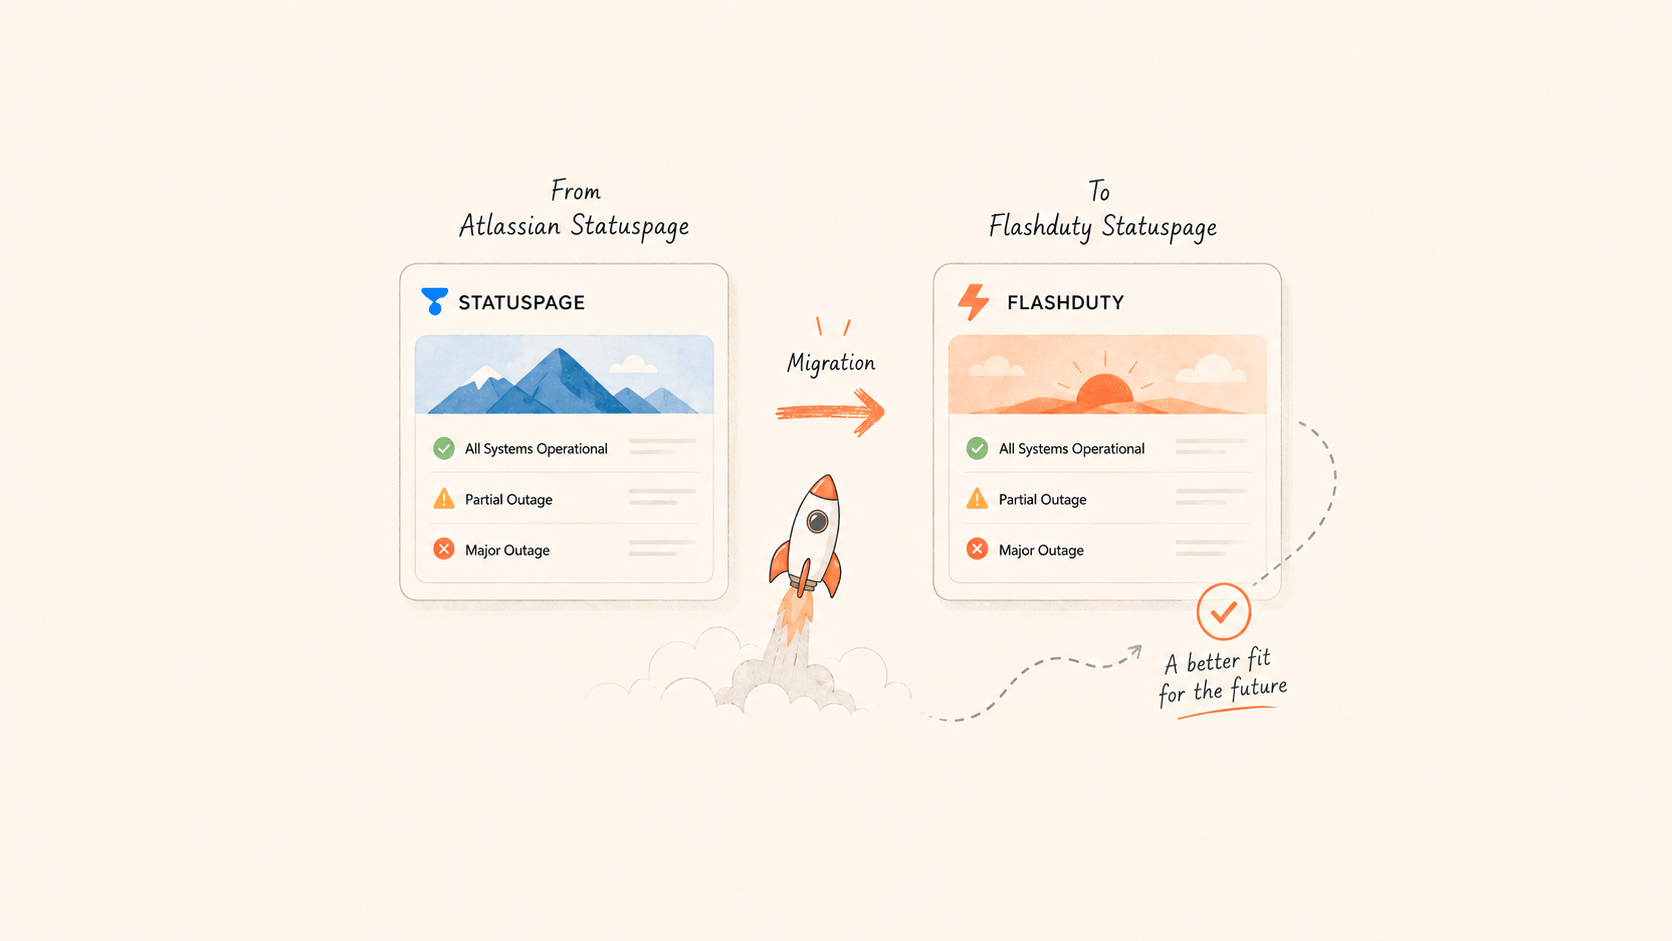
DeepSeek moved its public status page from Atlassian Statuspage to Flashduty Statuspage. The decision came down to Chinese support, cost, page experience, the credibility of self-hosting, and subscriber migration. The migration took two CLI commands.

Flashduty Support

Read more
Why DeepSeek moved its status page from Atlassian to Flashduty
  • AI SRE Settings Move Under Customize, and Memory Is Now Viewable and Editable in the Console

    This release brings four AI SRE changes: one Customize area for settings, memory you can see and edit, subagents that run in other environments, and Monitors data sources in AI SRE.

    Settings in one Customize area

    Knowledge, memory, plugins, and environments used to sit under separate menus. They now all live under AI SRE → Customize, with a second-level sidebar in three groups:

    • Context: Knowledge, Memory
    • Plugins: Overview, Apps, Skill, MCP, Agents
    • Environments: Self-hosted, Cloud

    Each Plugins and Environments item shows how many entries are configured. Row actions in the Skill, MCP, Agents, and self-hosted environment tables move into a "…" menu at the end of the row. The plugin overview adds search, lists enabled entries first, and marks entries that need your authorization.

    Memory you can view and edit

    Memory is the preferences, procedures, facts, and lessons AI SRE keeps from conversations. Each memory is now a Markdown file, and you can view and edit it at Customize → Context → Memory.

    • Two sources. You ask in a conversation to remember, change, or forget something, or the system writes down what later sessions will need when a session ends.
    • Two scopes. A session bound to a team writes to that team's memory. A session without a team writes to your personal memory. Each new session starts by reading the memory in its scope.
    • Preferences win. A preference you stated, such as "lead with the conclusion" or "use this time zone", takes precedence over a Skill's or tool's default when the two conflict.
    • Edit with AI. The input box at the bottom of the page can change several files at once. AI SRE shows a plan first and writes nothing until you confirm.
    • No silent overwrites. Each save carries the file's version. If someone else or another session changed the file in the meantime, the save is rejected and your draft is kept so you can review and submit again.

    Subagents can run in another execution environment

    When AI SRE dispatches a subagent, it can choose where the subagent runs: the cloud, or a self-hosted runner you are allowed to use. Before dispatching, the parent session can see which MCP connectors each environment has and what they do, and send the task to the environment that has the connector.

    For example, the parent session runs in the cloud, and the MCP connector for a database is bound only to a runner inside your network. The parent can dispatch a subagent to that runner, let it query through the connector, and get the result back.

    A subagent in the same environment shares the parent's workspace. A subagent in another environment gets its own session and workspace. In the conversation, each subagent row shows the environment it actually ran in, its token usage, and its duration. Environment permission checks and tool approval rules are unchanged.

    Monitors data sources in AI SRE

    From the Monitors → Data sources list, you can hand a data source straight to AI SRE:

    • Ask in AI SRE → in the name column opens an AI SRE conversation with a question that names the data source and its type already filled in. You decide when to send it.
    • The five diagnosis-only types, Redis Node, Redis Sentinel, MongoDB (mongod / mongos), and Kafka, get an AI analysis button on the row. It opens the AI SRE panel on the current page with the data source as context, and AI SRE connects to it once with its diagnosis tools. These types have no query workbench, so this is also how you confirm they connect.

    These entries appear only when the data source is enabled, the account has AI SRE turned on, and you have AI SRE chat permission.

    Get started

    Go to Flashduty console → AI SRE → Customize.

    Product docs: Memory, Context, Agents and subagents, Monitors data sources.

  • 235 New Alert and Change Integrations, and an Integration Catalog You Can Browse by Category

    Since September 16, Flashduty On-call has added 197 alert integrations and 38 change integrations. That brings the totals to 267 alert integrations and 41 change integrations.

    Alert integrations: 197 new

    They cover monitoring, APM, logs, synthetic checks, security, and IT operations. Some examples:

    • Monitoring and APM: Splunk Observability Cloud, Honeycomb, Instana, LogicMonitor, Sysdig, Checkmk, Netdata, PRTG, Icinga, LibreNMS, Sensu, Zenoss
    • Logs and error tracking: Sumo Logic, Elastic, Coralogix, Loggly, Papertrail, Rollbar, Bugsnag, Honeybadger, Firebase Crashlytics
    • Uptime and synthetic checks: Pingdom, UptimeRobot, Site24x7, Checkly, StatusCake, ThousandEyes, Catchpoint
    • Security: CrowdStrike, Okta, Wazuh, Falco, Snyk, GitGuardian, Trivy Operator
    • Cloud services and databases: MongoDB Atlas, OCI Monitoring, China Mobile Cloud, Tencent Cloud Live (CSS)
    • Open-source and scheduling systems: HertzBeat, DolphinScheduler, PowerJob

    Opsgenie-compatible endpoint

    The new Opsgenie Compatible integration implements alert creation and closing from the Opsgenie Alert API, with the same request and response formats. Tools that already send alerts to Opsgenie, such as Prometheus Alertmanager and Grafana Alerting, only need their API address changed to your Flashduty push URL.

    Change integrations: 38 new

    Deployments, configuration changes, and feature flag switches sent to Flashduty become change events linked to alerts and incidents. The new change integrations include:

    • CI/CD: Jenkins, GitHub, GitLab, Bitbucket, Azure DevOps, CircleCI, TeamCity, Buildkite, Octopus Deploy
    • Deployment and GitOps: Argo CD, Argo Rollouts, Flux CD, Vercel, Netlify, Heroku, Railway
    • Infrastructure as code: HCP Terraform, Pulumi, Scalr, env0
    • Feature flags: LaunchDarkly, Unleash, Flagsmith, GrowthBook
    • Developer platforms and config centers in China: Gitee, Zadig, Yunxiao AppStack, Apollo

    Integrations: browse by category, request what's missing

    With this many integrations, the add-integration panel under Integrations → Alert events / Change events has changed:

    • Grouped by category. Alert events open on Popular, change events open on CI/CD, and generic integrations come first. Less common categories sit behind More and can be collapsed again.
    • Full-screen catalog. Click All to open a full-screen catalog with category navigation on the left. Each integration shows its logo, name, and a two-line description, and search covers every integration.
    • Request an integration. If search finds nothing, click Request an integration and fill in the system name, a website or docs link, and a note. The system name is prefilled with your search term. We review the request and reply to your account email. Until then, you can connect through a generic integration.

    The integration catalog on our website also takes integration requests.

    Get started

    Go to Flashduty console → Integrations → Alert events or Change events and add an integration.

    Setup steps for each integration are in the alert integration and change integration docs.

  • Status Page Widgets: Put Your Live Status Where Your Users Already Are

    When an incident hits, your users' first instinct is to check your website or help center for answers. If your status page lives at an address they don't know, even the timeliest updates won't reach them.

    Flashduty Status Pages now ship with embeddable widgets: a snippet you can paste into any website's HTML to show your live service status on your own site, help center, or internal system — meeting your users where they already are.

    Two forms, two jobs

    • Status badge: an always-on indicator of your current overall status, available in three sizes, linking straight to your full status page — perfect for a footer or help-center home.
    • Incident banner: hidden by default and only appears at the top or bottom of the page during an ongoing incident or maintenance. Visitors can dismiss it, and scheduled maintenances show up automatically 24 hours before they start, so your users can plan ahead.

    Ready to use, styled your way

    Under Status page detail → Settings → Widget, you can configure the theme (auto / light / dark), language (Chinese / English), badge size, and banner position, preview the result live, and copy the embed code in one click. The widget runs as a Web Component with styles fully isolated from the host page, refreshes status every 30 seconds, and pauses automatically when the tab is hidden.

    A public JSON API, for everything else

    Beyond the ready-made components, every public status page exposes a keyless status summary endpoint, GET {status-page-url}/api/widget/v1/summary.json, with CORS and ETag support. Build your own rendering, feed an internal dashboard, or integrate status into any system you run.

    Widgets are enabled by default for all public status pages — no configuration required.

    Try it now

    Go to Flashduty console → On-call → Status Pages, open any public status page's Settings → Widget, and generate your embed code.

    Learn more in the product documentation.

  • Artifacts Get Public Links: Send a Report to Someone Without an Account

    Since the artifact gallery shipped, sharing a report the agent produced came with a precondition: the recipient had to sign in to the same Flashduty account. But the people who actually need to read that report are often outside the account — a customer, an external partner, a colleague who hasn't been onboarded yet, or a link you need to paste into a ticket.

    Public links are now available. On an artifact's detail page, click Share and switch visibility from Account only to Public link. Once generated, anyone with the link can open it directly — no sign-in, no Flashduty account required.

    What they see is a snapshot, not live content

    A public link shows the content as it was the moment you generated the link. If the agent updates the artifact later, the public link does not silently follow — that's deliberate: what you shared doesn't change behind your back. When a newer version is detected, the share panel offers Update snapshot; one click syncs the public content to the latest version, and the link itself stays the same, so links you've already sent keep working.

    When you no longer want it public, click Revoke public link and it stops working immediately.

    You're warned before it goes out

    Public means forwarding you can't control, so there's an explicit notice before you generate: anyone with the link can view the artifact, and the link may be forwarded further — don't share secrets, personal information, or unauthorized third-party content. The share panel also lists who holds manage permission on the artifact, so you know who can change its sharing state.

    Artifacts larger than 16 MiB can't generate a public link; those can still be shared in account-only mode.

    More file types can be published

    Artifacts are no longer limited to HTML and Markdown. Images, PDFs, data files such as CSV / JSON / YAML / XML, common source files such as Python / Go / TypeScript / SQL, and zip / tar.gz archives can all be published to the gallery now, and cards show a matching icon per type.

    Get started

    Go to Flashduty console → AI SRE → Artifacts, open any artifact, and click Share in the top right.

    For details, see the product documentation.

    This feature is available to On-call Professional accounts and above, alongside the AI SRE public beta.

  • ServiceMap (Beta): Who Is This Machine Actually Talking To

    Troubleshooting keeps coming back to one question: what is this machine actually talking to? The dependencies drawn in an architecture diagram and the ones that exist in production right now are rarely the same thing — a service is retired but stays on the diagram, a new call is added and nobody updates it, and after containers move around it stops matching entirely. So you end up on the host, reading connections one at a time.

    ServiceMap (Beta) takes a different route: instead of relying on a hand-maintained diagram, it builds the dependency topology among hosts, processes, containers, and workloads directly from the real network connections monit-agent observes through eBPF. It shows what is communicating right now, not what the documentation says should be.

    Turning "a connection" into "a service dependency"

    The raw fact the Agent observes is "this process connected to this ip:port". ServiceMap matches that target endpoint against known listeners within the same network scope to recover a service-level dependency, and labels how much you can trust it: a unique match is Confirmed; a match against several possible counterparts is Candidate, which you resolve with context; an endpoint that matches no listener is Unresolved and stays off the canvas by default, so external addresses and short-lived connections don't bury the real dependencies.

    On the canvas you can filter by resolution status, adjust the upstream and downstream hop range, and double-click any node to focus on just its neighborhood. Open a node or a dependency and the side panel gives you entity identity, executable, container and workload, target endpoint, resolution reason, candidate count, and confidence — these are exactly what tells you whether a dependency is trustworthy.

    Unresolved connections aren't hidden

    Endpoints with no matching counterpart are grouped by reason in their own panel, filterable by endpoint or source service, and exportable to CSV for offline reconciliation. From there you can also locate the source, jumping back to the canvas with the originating entity highlighted.

    It tells you how much to trust the picture first

    A topology is built from evidence within a recent observation window — it is not a live snapshot and it is not guaranteed to be complete. So the query info explicitly reports the capture mode, evidence freshness, the projection state of the listener inventory and Kubernetes metadata enrichment, and whether this query hit any truncation. If freshness isn't fresh, or a truncation notice appears, the graph can't be read as a complete real-time dependency set — showing you the basis for that judgment is more useful than handing you a graph that merely looks certain.

    Get started

    Go to Flashduty console → Monitors → Monitoring objects and click Topology on a host row, or use ServiceMap Hosts in the toolbar to browse every reporting host.

    ServiceMap is in beta, so its behavior and interface may still change. It relies on monit-agent's eBPF observation — if the Agent is too old, the runtime doesn't support it, or ServiceMap isn't enabled, there is no topology data.

    For details, see the product documentation.

  • AI SRE Open Public Beta: No Application, Sign In and Go

    AI SRE has finished its gradual rollout and is now in open public beta for every Flashduty account.

    Starting today:

    • No application — the beta request form and allowlist are gone; the AI SRE entry is visible to all accounts by default;
    • Sign in and go — open Flashduty console → AI SRE, pick a recent real alert, and let it investigate first;
    • Free during the beta — no separate billing; commercial pricing will be announced ahead of general availability, and charges will not start without confirmation.

    If your team lives in Slack, Feishu, DingTalk, or WeCom: when a war room opens for an incident, AI SRE automatically runs a first round of diagnosis and posts its findings back to the group — @ it in the chat to follow up.

    For a first run, walk through the quickstart: bind an incident, watch it return a conclusion with an evidence chain — about five minutes. For the full picture, see the AI SRE overview.

  • Artifacts Gallery: What the Agent Builds Doesn't Disappear With the Chat

    A report the Agent builds mid-session, an /insight summary for example, is useful in the moment and hard to find again once the chat window closes. You either scroll back through history or ask the Agent to run it a second time.

    The Artifacts gallery is now live. It collects the pages and reports the Agent produces with present_files and then publishes with publish_artifact, with search, scope filtering, renaming, sharing, downloading, and deletion.

    Published from a session, not uploaded by hand

    The gallery has no create-file entry of its own. Every artifact comes from something the Agent produced in a session. Two paths lead there: click New Artifact in the gallery and it opens a session with a prefilled prompt, the Agent asks about your audience, content, interaction, and visual style before building and publishing; or, more directly, any file the Agent surfaces with present_files in a chat carries its own Publish to gallery button.

    Refreshes when the source changes, permissions follow scope

    An artifact starts in the scope of the session that made it: output from a personal session belongs to its creator, output from a team-bound session belongs to that team and can be shared with other account members. You can move it between personal and any team you can access afterward. If the Agent later edits and re-presents the same source file, the published artifact updates in place, no manual republish needed. Who can rename, change scope, or delete depends on your relationship to the artifact: the creator, an account owner or admin, or, for team-scoped artifacts, any other member of that team. Without those rights you only get read actions like copy link and download.

    IM and API still answer in text by default

    The web console renders a published artifact as a card in chat. On IM, API, and automation channels, the Agent still answers in plain text by default, and only publishes when you explicitly ask to keep or share the output, or when the content itself needs rich formatting like charts or long tables, adding the link to its reply. That restraint is deliberate: most of the time a clear text answer beats an extra link to click.

    Getting started

    Go to Flashduty console → AI SRE → Artifacts.

    See the product documentation for details.

    AI SRE is rolling out to On-call Professional accounts and above, as part of the ongoing public beta.

  • Kubernetes App: Bring a Cluster Into AI SRE, on the Boundary You Draw

    Debugging a pod that keeps restarting usually takes more than metrics and logs. You need the pod's current state, its events, and what changed recently, and that information lives in the cluster, out of the Agent's reach.

    The Kubernetes App is now live, bringing a cluster into AI SRE's investigation flow. It uses the same mechanism as the GitHub App and GitLab App for repository access, the Customize App primitive, applied here to a cluster instead of a repository.

    Permissions scoped to the namespace

    Creating a Kubernetes App starts with a cluster name and a scope: Shared makes it available to any session in the account, or Team limits it to that team's sessions and the personal sessions of that team's members. For namespaces, choose All namespaces to apply one permission level across current and future ones, or Specific namespaces to pick read-only or read + limited write for each one individually. Leave namespaces unspecified and the Agent can only read basic cluster metadata, nothing about individual workloads. Installing the App does not hand the Agent the whole cluster.

    You run the install command yourself, the console doesn't do it for you

    After saving the configuration, the console generates an install command for you to run against the target cluster yourself. The command expires; reopen the install config or check the Manifest for a fresh one, no token rotation required. Change the namespace or permission scope later and you need to rerun the install command for the in-cluster RBAC to catch up.

    Revoking and uninstalling are two separate steps

    Revoking in the console immediately invalidates the connection and its token, but it does not automatically remove the Agent or RBAC resources already installed in the cluster. The console provides an uninstall command for that; run it against the cluster yourself. It only removes what this particular Kubernetes App installed, leaving the shared flashduty namespace untouched.

    Getting started

    Go to Flashduty console → AI SRE → Plugins → Apps → Kubernetes App.

    See the product documentation for details. For how this is built, why the agent runs real kubectl and why your cluster dials out to us instead of opening a port, see Safe cluster access for AI SRE.

    AI SRE is rolling out to On-call Professional accounts and above, as part of the ongoing public beta.

  • Where AI SRE Runs: Cloud Sandbox and a Runner Inside Your Network

    The difference between an Agent that only advises and one that goes and checks is whether it has somewhere to work.

    Every AI SRE investigation runs in a real execution environment: running commands, calling APIs, processing data, producing reports. That environment comes in two forms, and you pick based on where your systems live.

    Cloud Sandbox: works out of the box

    The default. Flashduty hosts it, creates it on demand when a session starts, and runs it in isolation. It ships with the command-line tools an investigation usually needs, so the Agent can read and write files, run scripts, and call public APIs directly. You can also give the cloud environment an egress allowlist, environment variables, and an init script, so every new Sandbox comes up matching your team's conventions.

    BYOC Runner: put execution inside your network

    When the systems under investigation sit on an internal network, a public environment cannot reach them. Deploy a Runner on your own machine instead, and the Agent executes from inside your network.

    The Runner dials out to establish the connection, so you never open an inbound port for it and never expose internal addresses to the public internet. It bundles the tooling an investigation needs, including rg, jq, gh, and the Node and Python runtimes, so there is nothing to install one by one afterward. It updates itself on every platform as server-side capabilities move forward, with no manual upgrade step.

    You still draw the execution boundary

    In either environment, what the Agent may write, which credentials it can use, and what network it can reach all follow your configuration. Production changes, restarts, rollbacks, and outbound notifications always wait for a human to confirm.

    Getting started

    Go to Flashduty console → AI SRE → Environments, where the tabs at the top switch between Self-hosted and Cloud.

    See the product documentation for details.

    This is available to On-call Professional accounts and above, alongside the AI SRE public beta.

  • AI SRE Connects to Your Code: Trace an Investigation Down to the Commit

    Investigations tend to stall at the same point: the logs name a function, and nobody can say offhand who changed those lines recently or why.

    AI SRE now connects to your code repositories. Both the GitHub App and the GitLab App are available, and the GitLab App has finished its allowlist rollout and is open to all accounts.

    Extend the investigation into the source

    Once authorized, the Agent can clone a repository, search the code, and read commit history and PR discussions. When it hits an unfamiliar function in a stack trace, it checks the implementation in the repository instead of answering from the model's impression. It also reads whatever conventions the repository ships with, such as CLAUDE.md or AGENTS.md, and follows your team's rules.

    From the error back to the commit

    Combining Flashduty's change records with repository history, the Agent can line up an exception with the commit that introduced it. One real case we recorded: a user triggered the same frontend exception three times, RUM preserved the session and the SourceMap stack, and AI SRE traced it to a form initialization bug, made a one-line fix, and opened a PR. Eight minutes from the last error. The full account is here.

    It opens a PR only when asked

    The Agent does not touch your code on its own initiative. Only when you explicitly ask for a fix in the session will it create a branch, commit the change, and open a PR for your team's normal review process. Whether a finding is worth a code change stays a human call.

    Tokens are injected per turn

    The repository access token is injected into the execution environment on each tool-calling turn, through the same path for a cloud Sandbox and for a BYOC Runner you host yourself. The authorization record stays in Flashduty, tokens can be rotated, and you can revoke access from the console at any time.

    Getting started

    Go to Flashduty console → AI SRE → Plugins → Apps and authorize GitHub or GitLab.

    See the product documentation for details.

    This is available to On-call Professional accounts and above, alongside the AI SRE public beta.

  • AI SRE Public Beta: Let the Agent Run the First Round of Investigation

    In the first ten minutes after an alert fires, most of an on-call engineer's time goes into assembling context rather than making a judgment.

    The alert lives in the monitoring platform, the incident timeline in Flashduty, the deploy in the release system, metrics and logs behind their own entry points, and the troubleshooting steps in a team document. Paste all of that into a general-purpose chat box and it can explain what usually exhausts a connection pool, but it does not know which change caused this one or which instances are failing.

    AI SRE is now in public beta, rolling out to On-call Professional accounts and above. It spent the past few months handling real alerts in private beta, and the door is now open.

    The session does not start blank

    Type @ in a new console conversation to reference an incident, and the Agent enters with that incident's alerts, services, teams, and on-call assignments already loaded. It plans its investigation from there instead of asking you what happened. The same applies when you summon it from your IM, where the war room discussion is also in view.

    It calls the tools you already connected

    MCP connectors reach your monitoring, logging, and cloud platforms. The built-in catalog currently offers 35 connectors. Your team's own troubleshooting procedures can be written up as Skills, and background about your systems goes into the knowledge base, so the Agent reuses both without being briefed again each time.

    Execution can run inside your network

    By default the Agent works in a Flashduty-hosted cloud Sandbox. When an investigation needs to reach internal systems, deploy a BYOC Runner in your own network. It dials out to establish the connection, so you never open an inbound port for it.

    Production actions stop with you

    The Agent finishes the investigation and proposes a root cause and next steps, but changes, restarts, rollbacks, and outbound notifications still wait for your confirmation. This boundary does not loosen during the beta.

    Getting started

    Go to Flashduty console → AI SRE → New chat.

    See the product documentation for details.

    AI SRE is now in open public beta — no application needed; sign in to the console and start using it. There is no separate charge during the beta, and the feature set and interface may still change.

  • RUM Explorer Adds Natural-Language Query

    Filtering for "Chrome errors that took over 2 seconds" in the RUM Explorer meant knowing the right field names and how to combine operators first. If you did not use DQL often, that step alone could stop you before you got to the data.

    The Explorer now accepts a plain-language description of what you want to find. Whether you are filtering sessions or events such as views, resources, and errors, AI turns the description into the matching DQL query.

    Describe it in one line, AI writes the query

    Click the AI Natural-Language Query icon on the left of the query field, or press ⌘+Enter (Ctrl+Enter on Windows/Linux) from normal query mode. The field switches to natural-language input. Press Enter and AI returns a preview: the generated DQL shows as a code snippet you can see and copy before applying anything. If the description fits a different event type better, the preview calls that out as a separate change. Clicking apply writes the DQL into the query field, where it behaves exactly like anything you typed by hand and can be edited further. The success toast after applying includes an Undo.

    Time phrases resolve in your timezone, capped at 14 days

    Phrases like "last hour" or "yesterday" are converted using your account's timezone and update the time picker directly, rather than turning into a query field. If the requested span exceeds 14 days, such as "the past month," it is automatically clamped to the most recent 14 days, and the preview flags the truncation. This ceiling matches the Explorer's own maximum query range. It is not a limit specific to natural-language queries.

    Getting started

    Open the RUM Explorer and click the AI icon on the left of the query field. See the product documentation for details.