
Most companies run more than one monitoring or observability system: cloud and on-premises, open-source and commercial, metrics, logs, and traces. Each tool has a different experience, permissions are hard to manage, and technical leaders often struggle with how to unify the stack and empower every team.
To solve this, start by looking at a typical monitoring and observability architecture:

- Collection is diverse: metrics use Categraf, Telegraf, and exporters; logs use Filebeat, Fluent Bit, and iLogtail; traces use SDKs and OpenTelemetry Collector.
- Transport depends on volume and reliability: small data can use HTTP; high-volume reliable transport often uses Kafka. Logs are more complex because ETL may involve Fluentd or Vector.
- Storage is relatively settled: metrics often use VictoriaMetrics, trace data often uses ClickHouse, and logs use ElasticSearch or ClickHouse. The newer VictoriaLogs also looks promising.
- Visualization often uses Kibana in the ElasticSearch ecosystem and Grafana elsewhere.
- Alerting is much less unified. Metrics may use Prometheus, vmalert, or Nightingale; logs may use ElastAlert, Nightingale, or Grafana; traces are often handled separately; cloud monitoring and observability products also build their own alerting stacks.
Two Ways to Unify
There are usually two approaches: replace old systems with a new system, or integrate and reuse existing systems.
- Replace old systems. This tries to replace multiple existing systems with one new system. The migration cost is high, and the selection risk is also high: every existing system has its own strengths, so why should the new system be better in every area? If the new system truly replaces everything cleanly, the unified experience is a benefit.
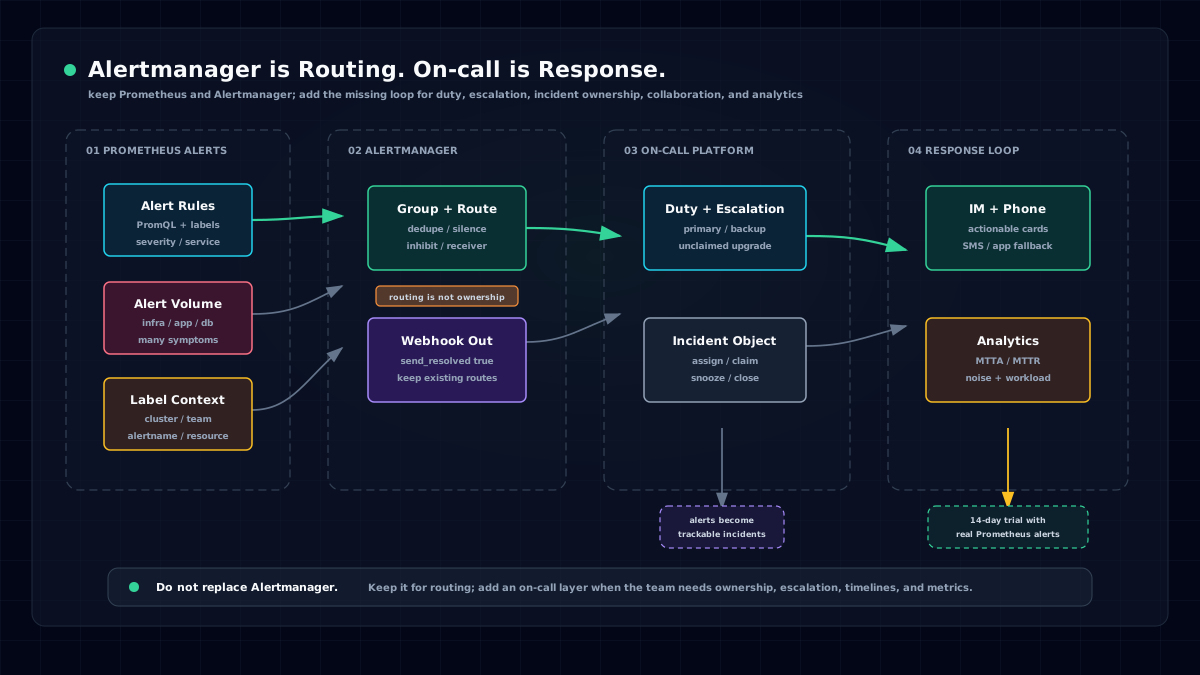
- Integrate and reuse. Add a thin layer above existing systems. Grafana follows this path for visualization: connect many data sources and provide unified visual analysis. Alerting lacked a comparable unification layer until Flashduty.
Everyone knows Grafana, so this article focuses on Flashduty's unified alerting capabilities.
Unified Alerting Capabilities
Alerting can be divided into two parts: alert event generation and alert event distribution.
- Alert event generation. Monitoring systems usually provide this. They periodically query storage, evaluate data against user-configured rules, and generate alert events. After relabeling, silencing, suppression, and other processing, they produce events that need notification.
- Alert event distribution. After events are generated, they must be sent to recipients. This usually involves noise reduction, scheduling, acknowledgement, escalation, and conditional dispatch to different notification channels.
Most monitoring systems can generate alerts, and some can also distribute them. But there are two problems:
- Alert-rule configuration differs significantly across monitoring systems. There is no unified top-level design, so users have to learn each tool separately.
- Monitoring systems can push alerts to recipients through some channels, but this part is often rough. Their focus is collection, storage, visualization, and the alert engine; event distribution is usually not the product center. Different monitoring systems also design this area differently, creating inconsistent user experience.
Some managers do not pay enough attention to reliability or do not understand monitoring systems deeply enough to see this problem. In more mature markets, dedicated products have existed for years, such as PagerDuty and Opsgenie, both multi-billion-dollar public companies.
These products are usually positioned as unified On-call platforms: they integrate with many monitoring systems, collect alert events in one place, reduce noise, dispatch events, and produce reports that analyze response timeliness.
In recent years, China has moved quickly in technical maturity. Service reliability and business continuity are now more important, and products similar to PagerDuty and Opsgenie have emerged. Flashduty is one of the strongest examples.
Introducing Flashduty
Flashduty is more complete than a pure distribution tool. Like PagerDuty, it can flexibly distribute alert events, but it can also generate alert events directly. Let's look at both.
Flashduty Distributes Alert Events
Most monitoring systems support pushing alert events to third-party systems through Webhook or Email. Flashduty uses both methods to integrate with monitoring systems, collect their alert events, and then provide noise reduction, scheduling, and collaboration.

The image shows current Flashduty integrations, and the list keeps growing. After events are sent to Flashduty through Webhook or Email, Flashduty handles them uniformly:
- Label enrichment: attach meaningful metadata to alert events for filtering, viewing, and correlation.
- Event processing: modify alert events by condition, or filter and suppress them.
- Routing: route alert events by attributes and labels into specific workspaces, usually specific teams.
- Dispatch: each workspace has dispatch policies, and different alert levels can use different notification channels.
- Dispatch can connect to schedules so not everyone is interrupted.
- Acknowledgement and escalation ensure alerts are eventually handled.
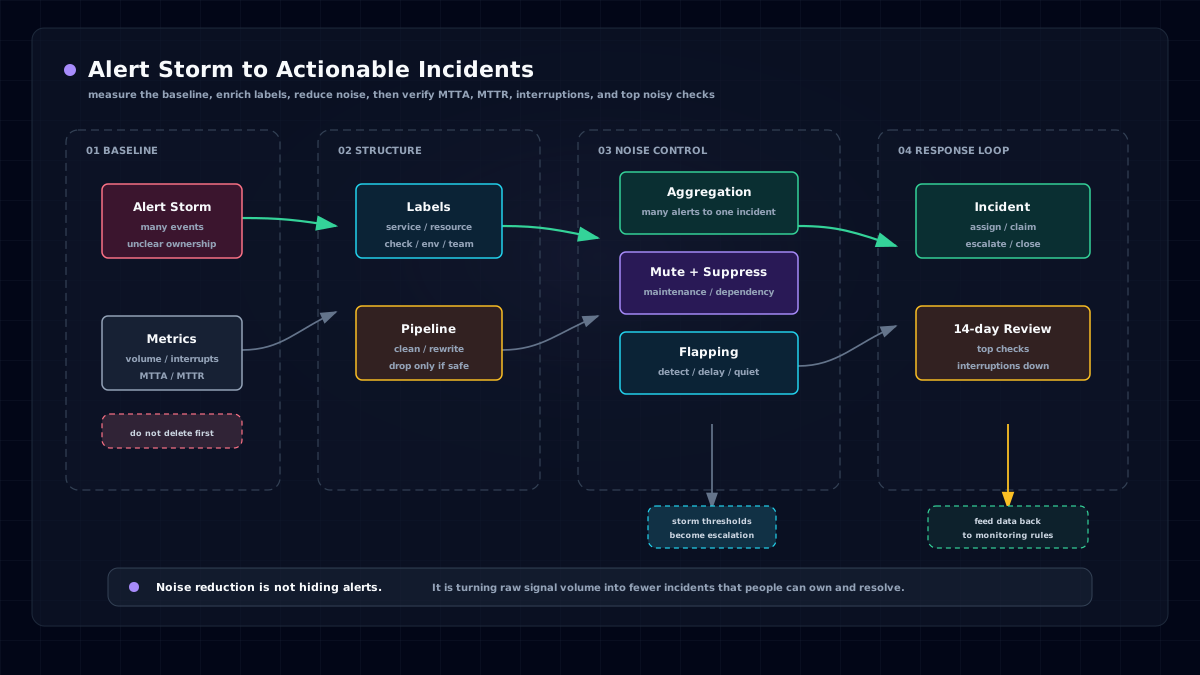
- Noise reduction can merge multiple alerts into incidents to solve alert storms.
- IM integrations make mobile response practical, especially at night.
Flashduty Generates Alert Events
Flashduty is not only a unified On-call center. It is also a unified alert engine. Users can configure alert rules, connect different storage systems, periodically query and evaluate data, and generate alert events.

This is the Flashduty alert rule list page. It currently connects to Prometheus, VictoriaMetrics, Thanos, M3DB, MySQL, Postgres, Oracle, ElasticSearch, Loki, ClickHouse, and other storage systems for alert evaluation. It can alert on metrics and logs, and also on business data.
Flashduty also provides an open-source event-monitoring engine that can directly inspect the site through scripts and generate alert events. The entry is the "Event Monitor" menu:

With this design, Flashduty can both generate alerts from data and distribute events with noise reduction. Monitoring and observability systems can focus on data collection, storage, visualization, and analysis. The boundaries are clear and the user experience is consistent.
Try Flashduty for Free
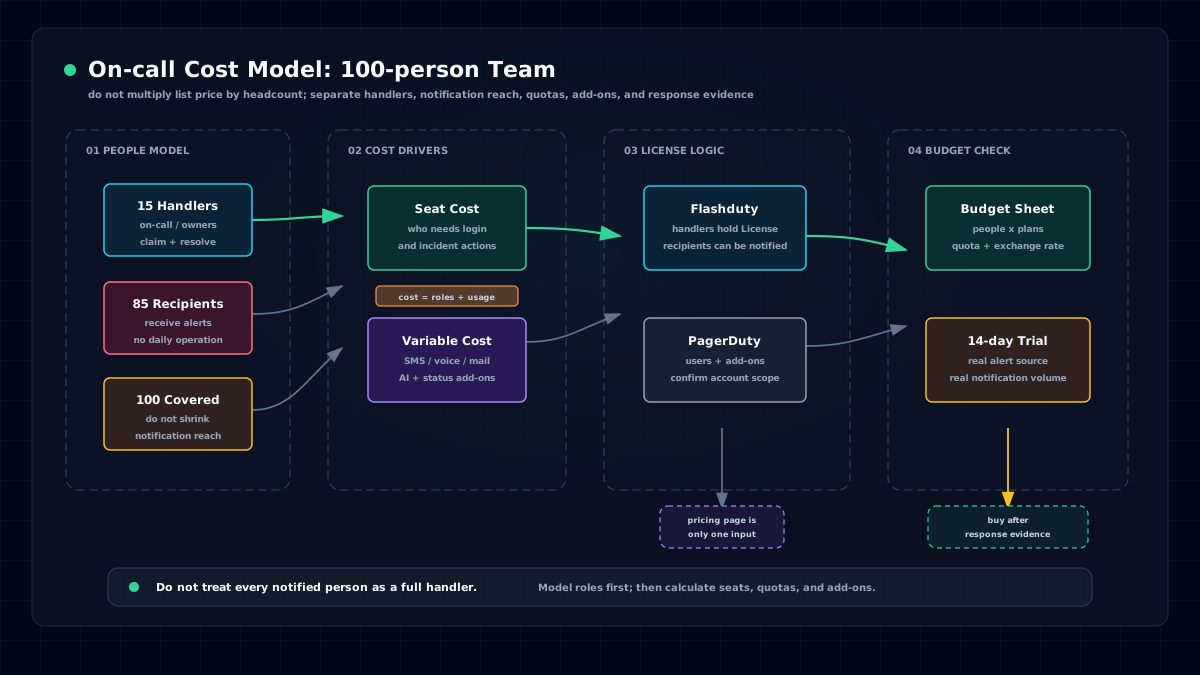
Flashduty has paid plans and a free plan:
- Product: https://flashcat.cloud/product/flashduty/
- Signup: https://console.flashcat.cloud/
The event-generation feature is available even on the free plan. If you have questions, you can contact me on WeChat: picobyte.