
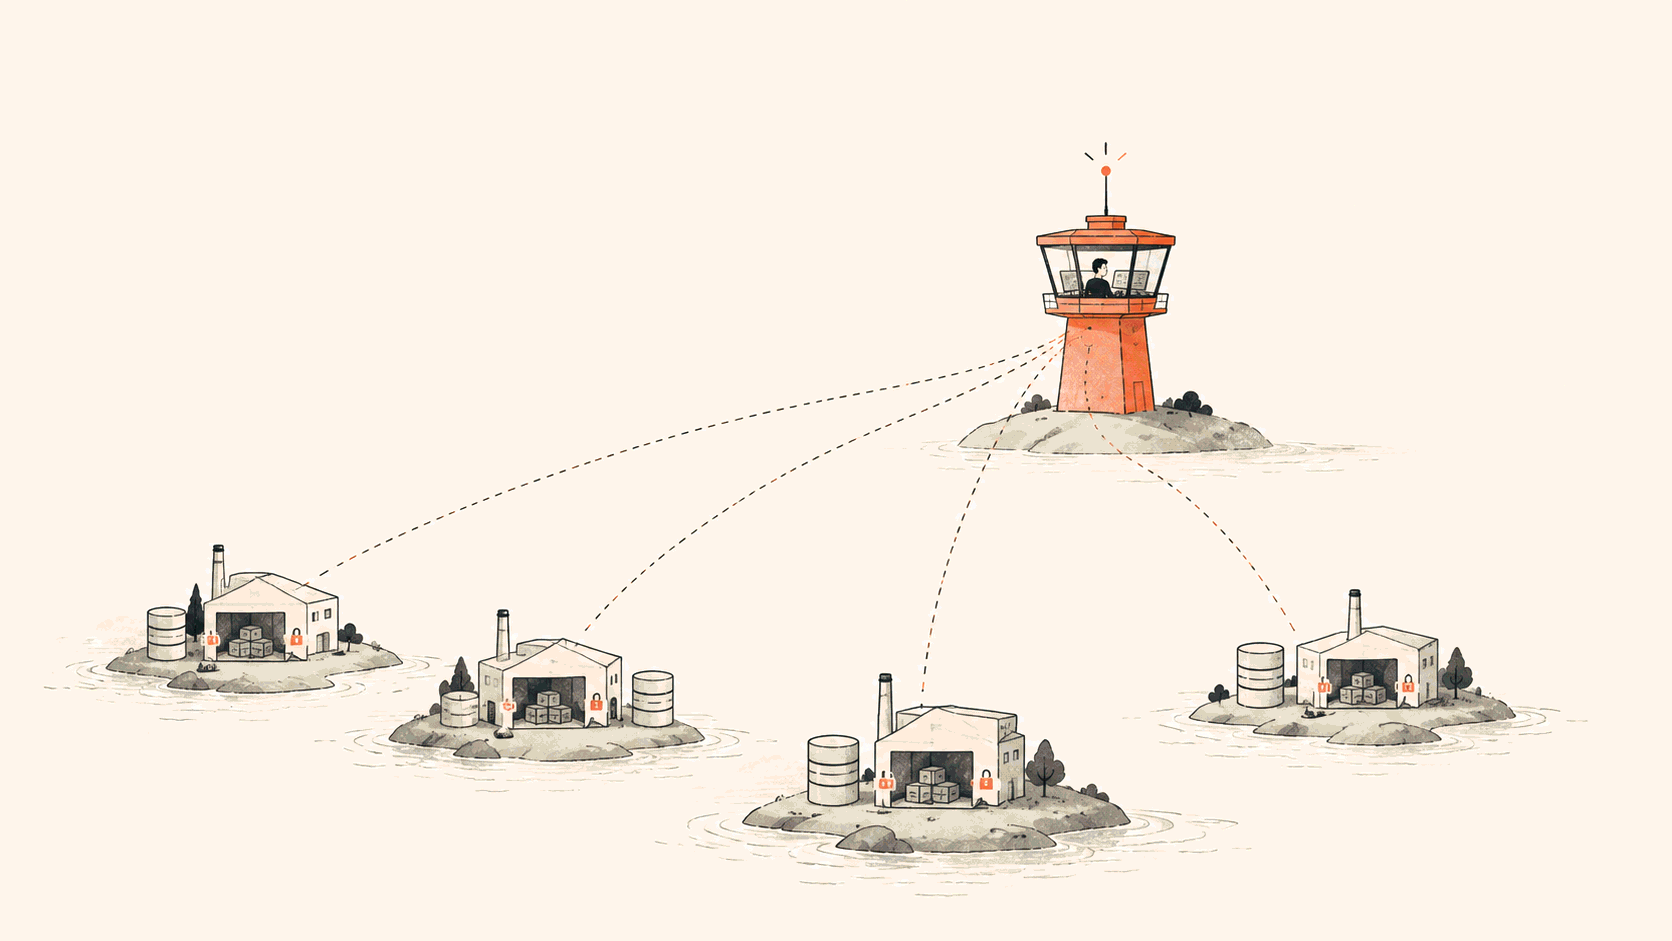
Flashduty Monitors leaves your data where it is and puts alerting in one place. Monit Edge runs inside each private environment and queries local data sources. One SaaS control plane manages rules, runtime status, and ad hoc queries. You can apply one rule to many data sources, see on a rule tree where alerts and failures cluster, and skip copying telemetry into a new store.
Who this is for
Some companies keep data spread out for good reasons. A manufacturer may run a Prometheus in each of a dozen factories. The group may have ClickHouse clusters in several regions, and teams run their own PostgreSQL, MySQL, and logging systems. Network isolation, data sovereignty, and cost keep it that way.
These companies have plenty of monitoring tools. The trouble is that operating them splits up along with the data. Teams configure the same infrastructure alert in every Prometheus. To check one region, you first find its URL and credentials. Some rules fail to run while others fire, and the on-call engineer pieces it together across several systems. Each new data source adds more of this work.
Centralize control, not data
You could copy telemetry from dozens of environments into a new SaaS store. That brings its own costs: network egress, long-term retention, compliance reviews, migration, and keeping the new platform consistent with your existing pipelines.
Monitors avoids that. Monit Edge runs in your environment, connects to local data sources, and runs queries there. Flashduty SaaS manages rules, collects runtime status, and handles queries and charts when you need them. Raw telemetry doesn't have to be copied into SaaS continuously. You don't have to buy a second telemetry store just to get central alerting.
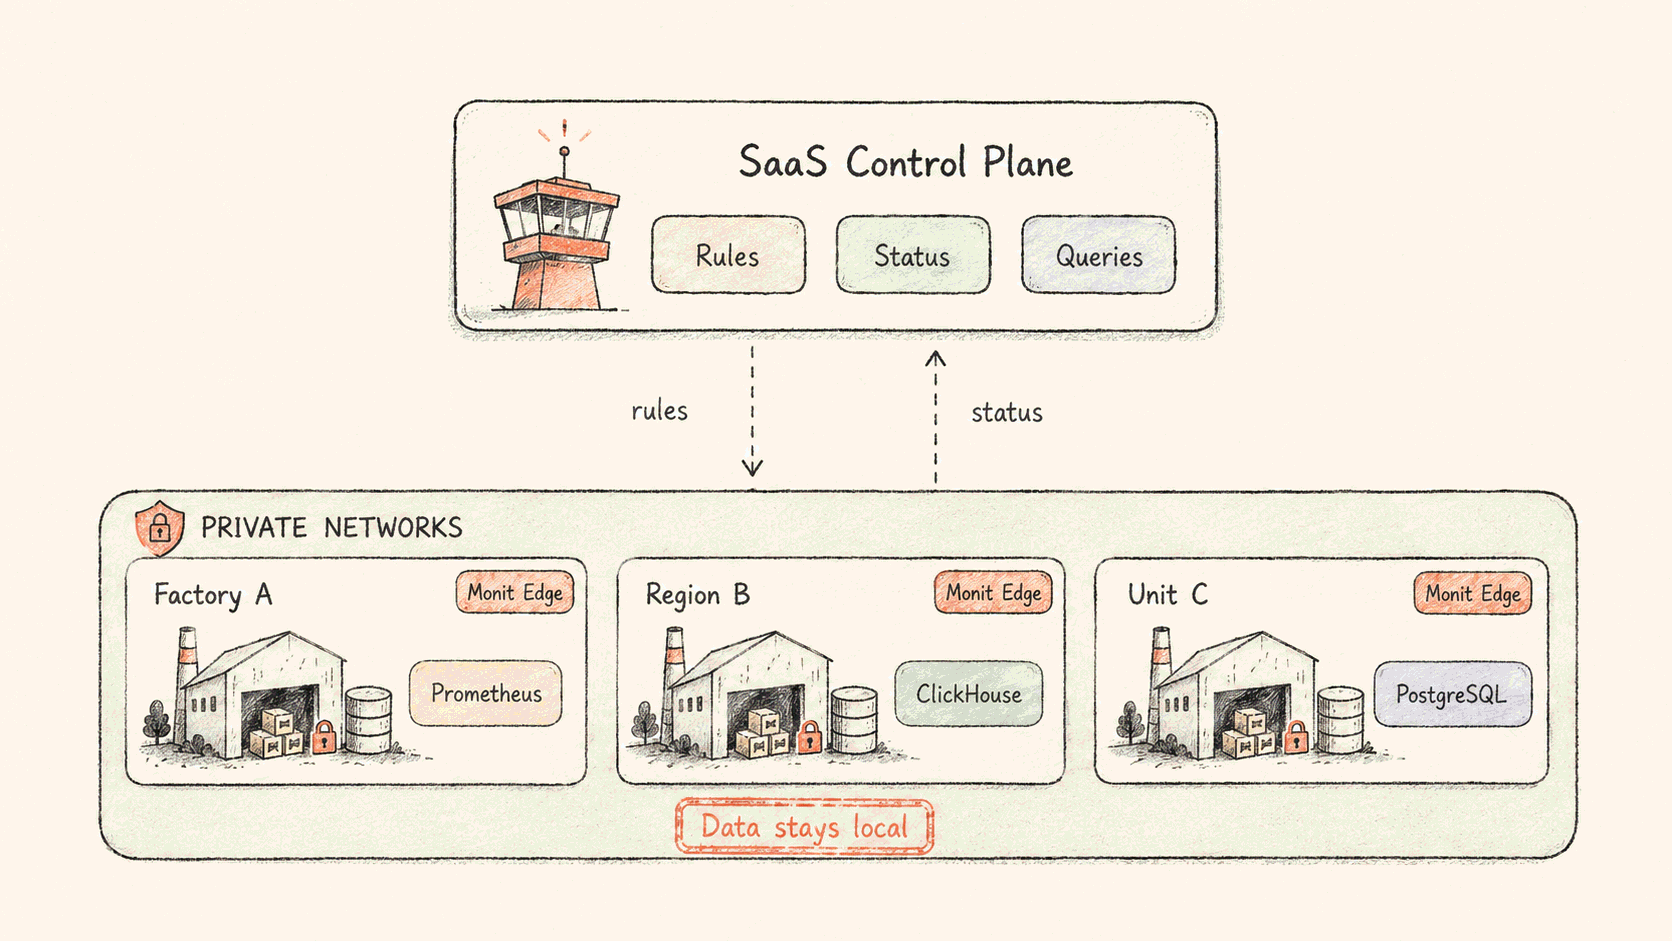
It fits places where one central monitoring deployment isn't realistic:
- Factories or campuses with isolated data sources and networks.
- Regions separated by data-residency or cross-border rules.
- Business units with their own data platforms and ops teams.
- A mix of Prometheus, ClickHouse, PostgreSQL, and other systems left by mergers and years of growth.
- Many small edge sites, where central storage doesn't pay off.
One rule, many data sources
Take 20 factories, each with its own Prometheus. If each one defines its own alerts for CPU, disk, instance health, and key services, you end up with 20 copies of the same rules. Changing a threshold, adding a label, or adjusting a recovery condition means doing it 20 times. Over time the copies drift apart.
In Monitors, one alerting rule can apply to many data sources. You maintain the rule once, and it runs against every matching source. If your factories, regions, or business units share metric conventions, you write fewer rules and keep them consistent.
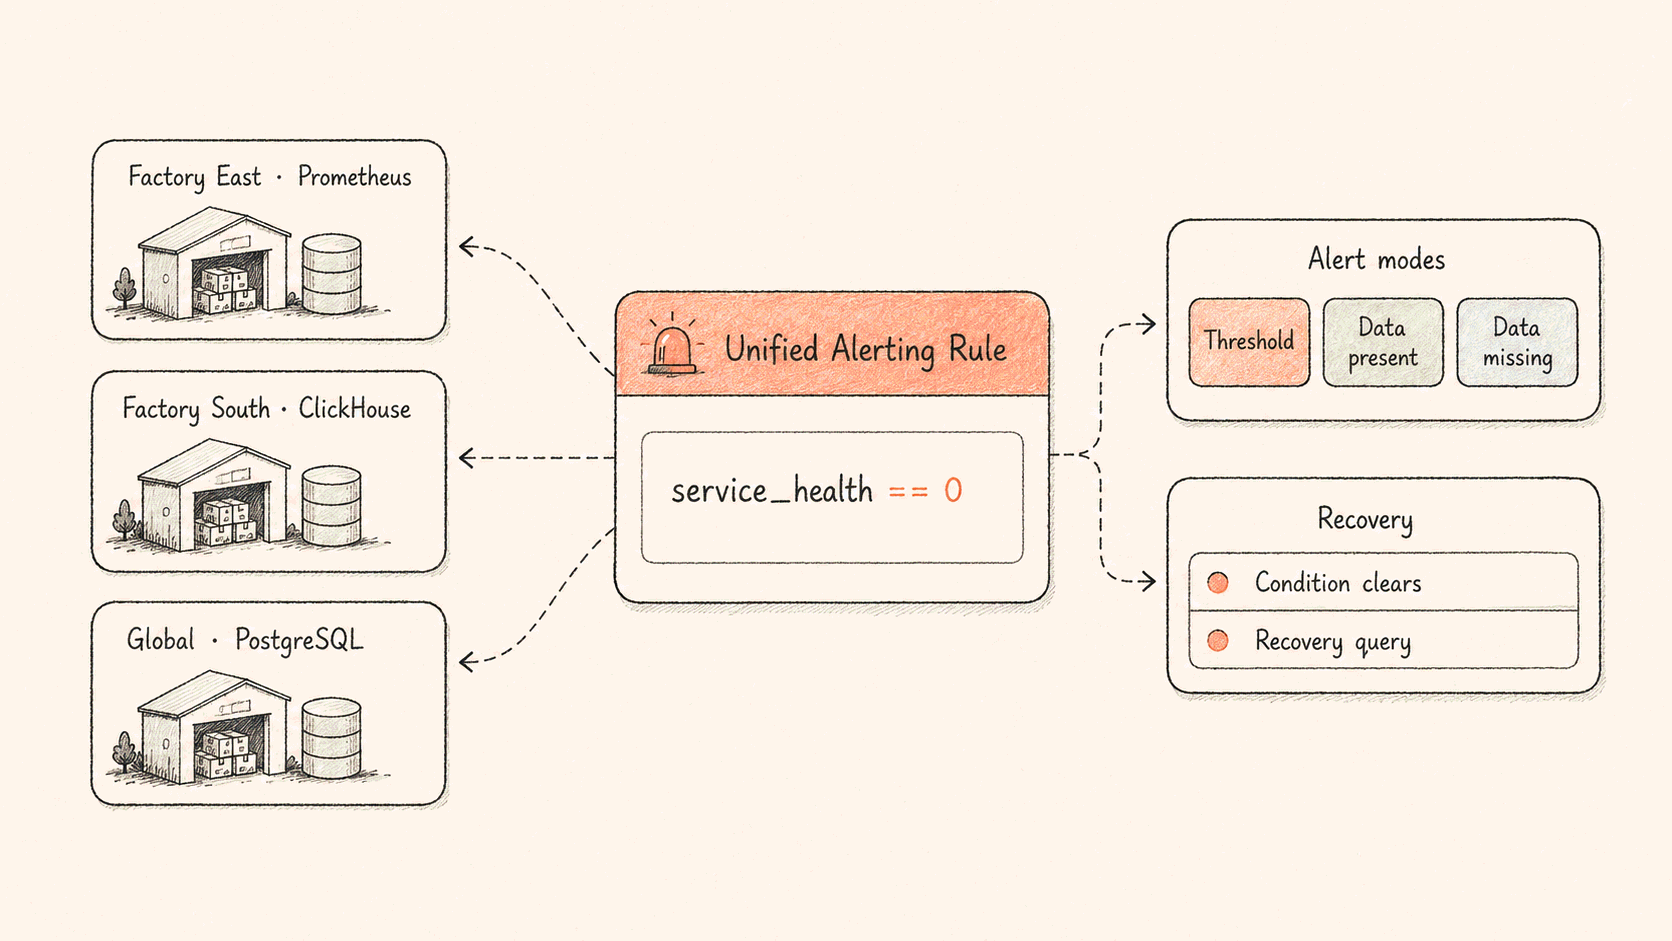
Rules support more than one check. Monitors has threshold, data-present, and data-missing alerts. A metric crossing a threshold can fire an alert. So can a query that returns matching records, or a signal that stops arriving. Recovery can happen when the alert condition clears, or when a separate recovery query confirms the business is back to normal.
The separate recovery query is there for a reason. A queue dropping below a threshold and the order pipeline producing successful transactions again are related, but they are two different signs of recovery.
The rule tree shows where problems are
A flat list stops working once you have many rules and data sources. During an incident you ask in layers. Which business group is alerting? Which region has failed rules? Which sites are fine?
Monitors organizes rules as a tree. You can build it by group, region, factory, business unit, or another boundary. Each node shows its active alerts and rule failures, so the tree doubles as a live status map.
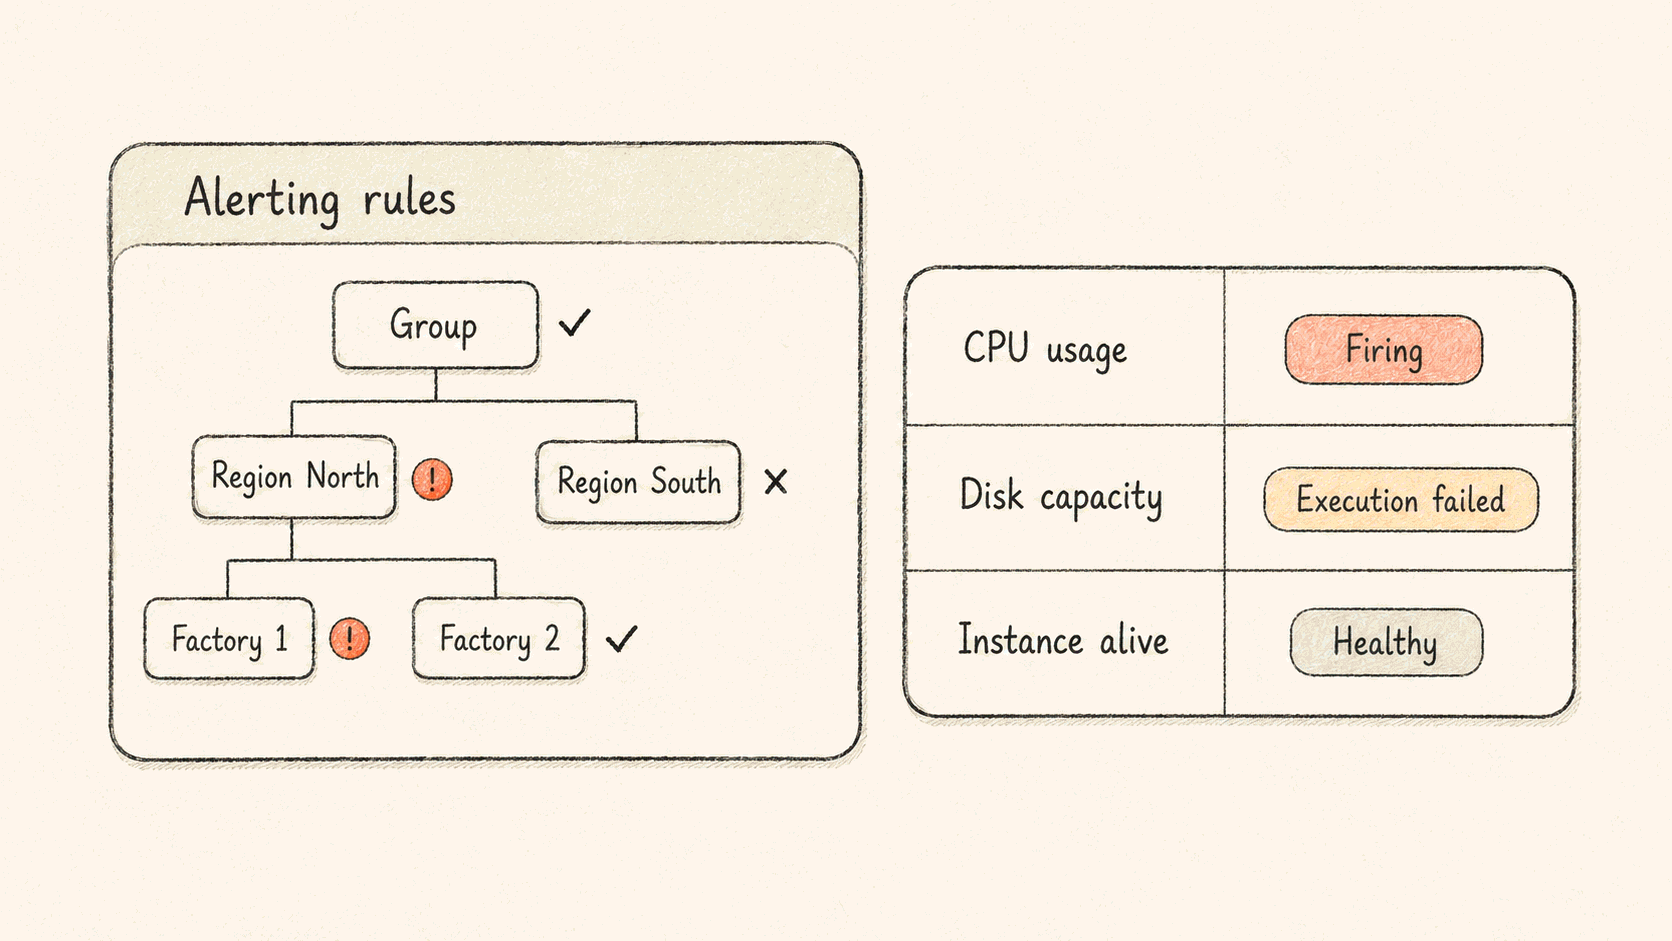
An unreachable data source shows up on its node. Nobody has to stumble on it in a rule detail page. A burst of alerts from one factory is visible without filtering dozens of records. The tree answers the first incident question: where is the problem?
One place for ad hoc queries
An alert tells you something is wrong. To investigate, you still need the data. Without one entry point, on-call engineers sign in to each factory or regional system, remember where each data source lives, and repeat similar queries across browser tabs.
Monitors now has an ad hoc query workbench. You pick a data source and run a query from one page, instead of signing in to every system on the customer network. Prometheus metrics, database queries, and more data sources can move into the same workflow over time.
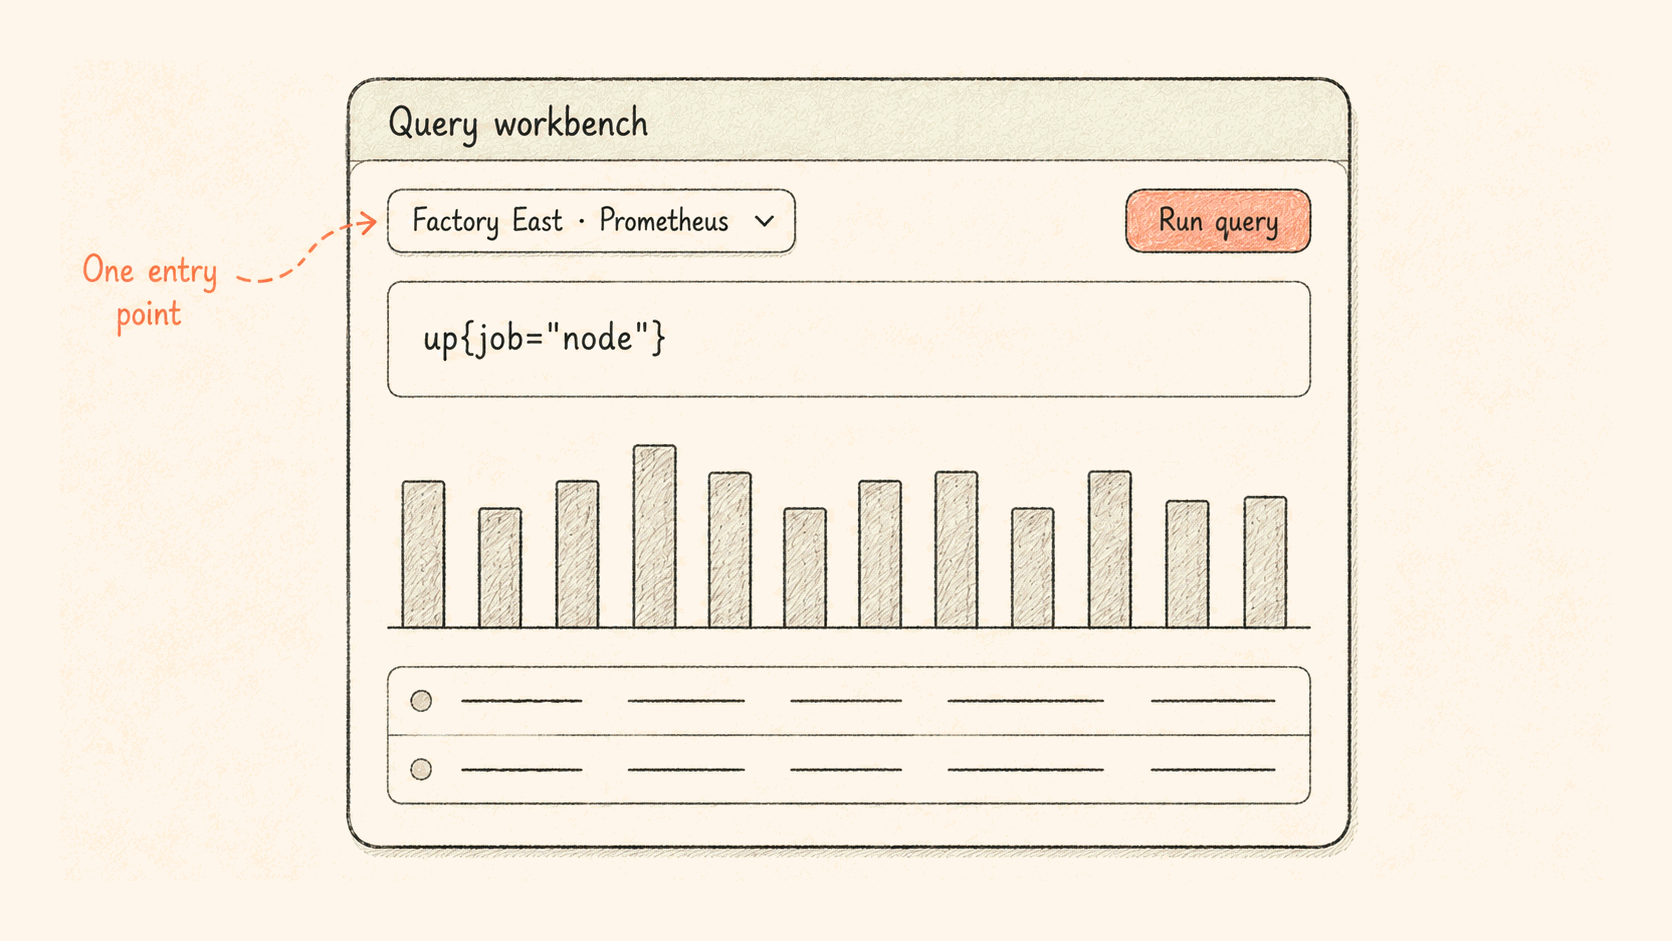
Data ownership doesn't change. Queries still run against data sources in the customer environment. SaaS provides the entry point and the result view. On-call engineers stop hunting for the right system and just pick a source. Platform teams hand out fewer backend credentials and expose fewer admin endpoints.
Built on Nightingale
Flashcat has maintained the open-source Nightingale monitoring project for years. Its approach to multi-source alerting, rule governance, and daily investigation has run in many enterprise environments.
Monitors brings that experience to a cloud–edge setup. You keep distributed data sources and private execution, and you no longer run your own monitoring control plane. AI-assisted query writing and dashboards are in development. Over time, alerting, ad hoc queries, charts, and AI-assisted investigation will share the same data-source layer, and you won't have to migrate all your telemetry to get there.
Lightweight and included
Flashduty Monitors does not require a new centralized TSDB, historical data migration, or additional fees based on telemetry storage volume. The service is available to teams with a Flashduty On-call account.
If you already run Prometheus, ClickHouse, PostgreSQL, or other data sources across factories, regions, or business units, keep them. Connect the sources you have and standardize your most important alert rules first. Then add ad hoc queries, and dashboards and AI-assisted investigation as they ship.