
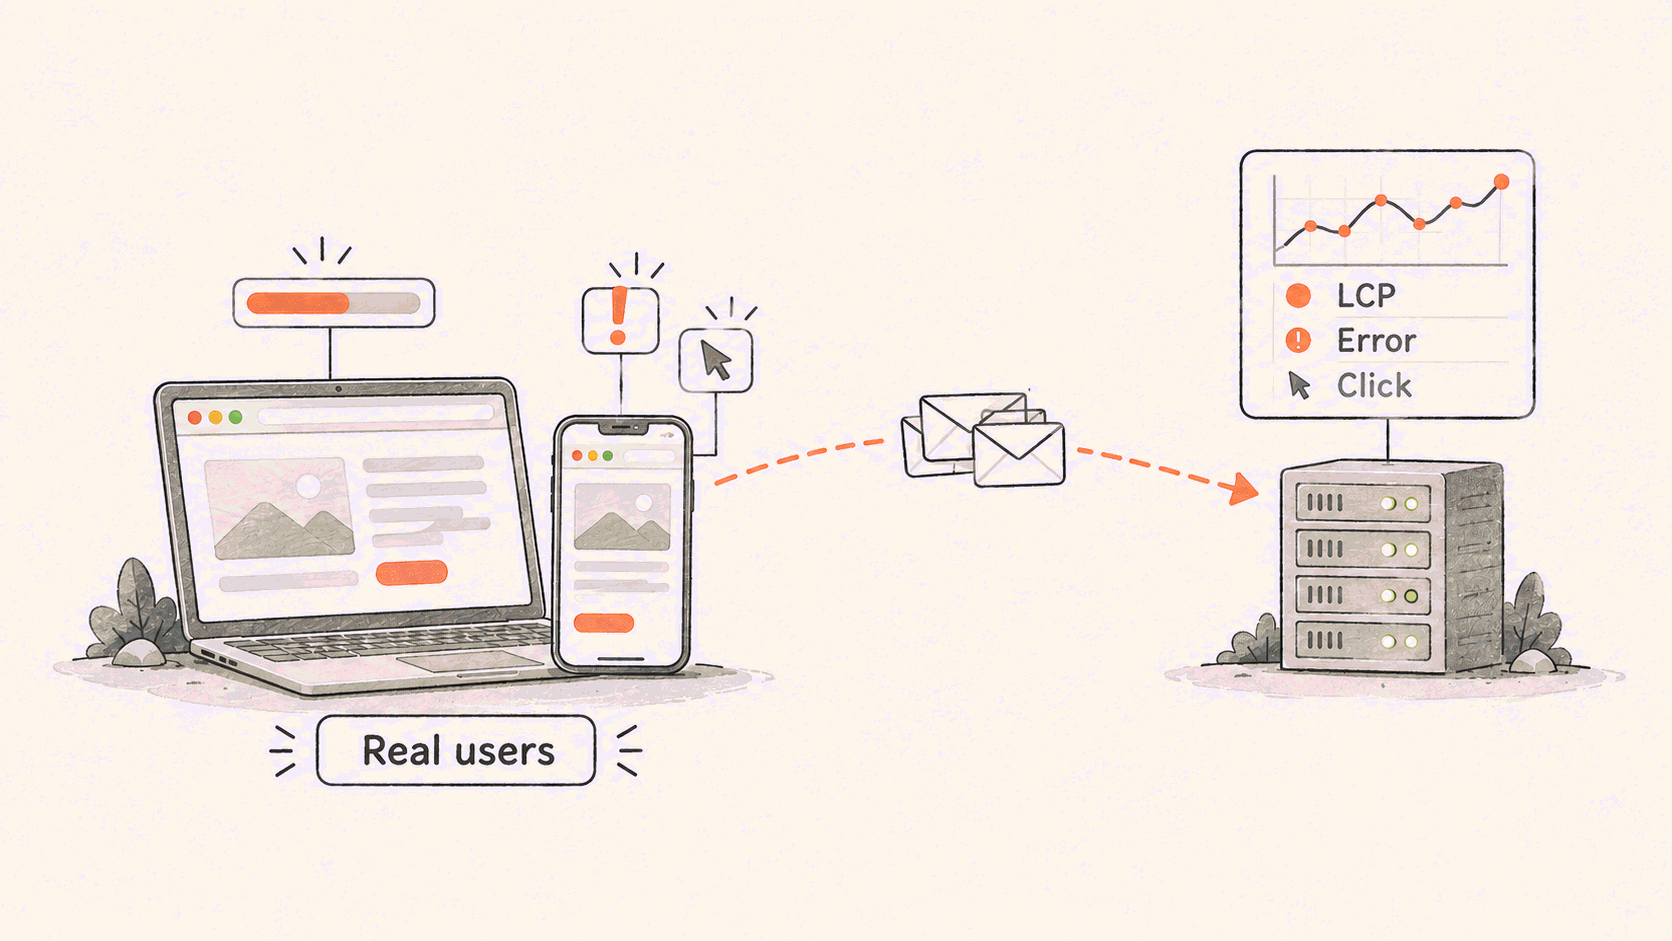
Browser RUM (real user monitoring) is a JavaScript SDK that you load into your web pages. While real visitors use the site, it records what their browser went through: how long each page took to load, the Core Web Vitals (LCP, INP, CLS), how long each API request and asset took, which JavaScript errors were thrown, what the user clicked, and which long tasks blocked the main thread. Events are grouped into sessions, tagged with browser, device, OS, location, and release, and sent in batches to a backend where you can query them. It answers "what did real users experience", which a lab test or a backend dashboard cannot.
What a browser RUM SDK records
The Flashduty browser SDK records six kinds of events. Each event also carries default attributes such as view.url, browser.name, device.type, geo.country, env, and version, so any of them can be split by page, browser, region, or release.
| Event | What it contains |
|---|---|
| Session | One visit: first and last page, whether a replay was recorded |
| View | One page or route: Navigation Timing, LCP, INP, CLS, FCP |
| Resource | Each image, script, stylesheet, XHR, or fetch: timing and status |
| Error | Uncaught exceptions, console errors, network failures, plus errors you report yourself |
| Action | Clicks and form submissions, plus custom actions you send with addAction |
| Long task | JavaScript work that blocked the main thread long enough to cause jank |
The full field list is in Web SDK data collection.
Raw events are only half of it. On the backend, similar errors are grouped into one Issue with a count of affected users and the release where it first appeared. If you upload the source map that matches each release, a minified frame like index-q2_vQxih.js:134:36624 is restored to the original file, function, and line. Source mapping covers the upload.
How RUM differs from synthetic monitoring and APM
Synthetic monitoring runs a scripted browser or HTTP probe from fixed locations on a schedule. It works when nobody is on the site, so it can catch an outage at 3 a.m. and gives a stable baseline to compare releases against. It only tests the paths you scripted, on the network and hardware of the probe.
RUM is the opposite trade. It needs real traffic, and a page nobody visits produces no data. In return it covers every browser version, phone model, ISP, and region your users actually have, including the combinations nobody thought to test. A slow LCP that only shows up on mid-range Android phones on mobile networks is a RUM finding.
APM and distributed tracing start at your servers. They can tell you an API took 80 ms, but not that the user waited 3 seconds because a script blocked rendering first. Browser RUM can bridge the two: list your API domains in allowedTracingUrls and the SDK adds a W3C traceparent header to those requests, so a slow request in RUM opens the matching backend trace. See distributed tracing.
Most teams that care about uptime and user experience run more than one of these. RUM does not replace a health check that pages you when the site is down for everyone.
What browser RUM will not see
Knowing the blind spots matters more than the feature list.
- Sampled-out sessions.
sessionSampleRatedecides per session whether to record it. A session that is not sampled sends nothing, errors included. At 20%, four out of five users can hit an error you never see. Web SDK 0.3.0 and later can keep error sessions withsessionOnError; the sampling guide explains the options. - Anything before the SDK starts. With the npm package or the async CDN snippet, errors, resources, and actions that happen before initialization are missed. The synchronous CDN snippet, placed first in
<head>, catches them at the cost of blocking. - Users with ad blockers. Some blockers stop the SDK or its intake requests, and those sessions are simply absent from your data.
- Browser API gaps. Long tasks are only reported in Chromium-based browsers, and Web Vitals support is partial on Firefox and Safari. The standard SDK does not run on Internet Explorer; a legacy build for IE 9 to 11 collects only uncaught errors without stacks, load time, views, and manual events. Details are in browser compatibility.
- Your servers. RUM shows the request was slow or returned 500. Why the server did that is a job for logs, metrics, and traces.
What the SDK costs the page
Flashduty publishes its benchmark in Web SDK performance impact. For a typical business page with RUM, resource, and long-task collection on (p50):
| Metric | Added by the SDK |
|---|---|
| Bundle size | 50.0 KB gzipped |
| Initialization | 7.8 ms |
| First Contentful Paint | +24 ms |
| Main-thread CPU over a 10 s window | +36 ms |
| Upload per session window | 30.5 KB |
Session replay is the expensive part. On ordinary pages it adds little, but on a page with a large table the same benchmark measured +757 ms of CPU and about 1.7 MB of upload. Keep sessionReplaySampleRate low (the docs suggest 1 to 10) and raise it only on pages you are debugging.
Uploads are batched: the SDK sends when a batch reaches 50 events or 16 KB, every 30 seconds, and on page unload, using the Beacon API so the last batch is not lost when the tab closes.
Setting up browser RUM in Flashduty
- Create a Web application in the RUM console and copy its Application ID and Client Token.
- Install the SDK. With npm:
npm install @flashcatcloud/browser-rum, then callflashcatRum.init()in your entry file. Without a build step, use the CDN snippet. - Set
service,env, andversionon init. Version is what makes "first seen in release X" and source-map lookup work. - Pick a sample rate. The docs suggest 100 in staging, 50 to 100 for small and medium production traffic, and 10 to 30 for high traffic.
- Open DevTools and check for requests to
browser.flashcat.cloud/api/v2/rum. Data usually shows up in the console within 2 to 5 minutes.
The Web SDK integration guide has the full snippet and every init option.
Once errors are grouped into Issues, you can turn on alerts per application. An Issue alert goes either to a Flashduty channel, where it follows that channel's escalation rules and notifies whoever is on call, or to your own webhook URL. Only channel delivery requires On-call. How the rest of the pipeline can work is in our case study of a user error turned into a fix PR in 8 minutes, where AI SRE used the session, release, and restored stack from RUM to find the bug.
Flashduty RUM also has SDKs for iOS, Android, HarmonyOS, Flutter, React Native, Electron, and WeChat mini programs with the same data model. The RUM product page shows what the console looks like.