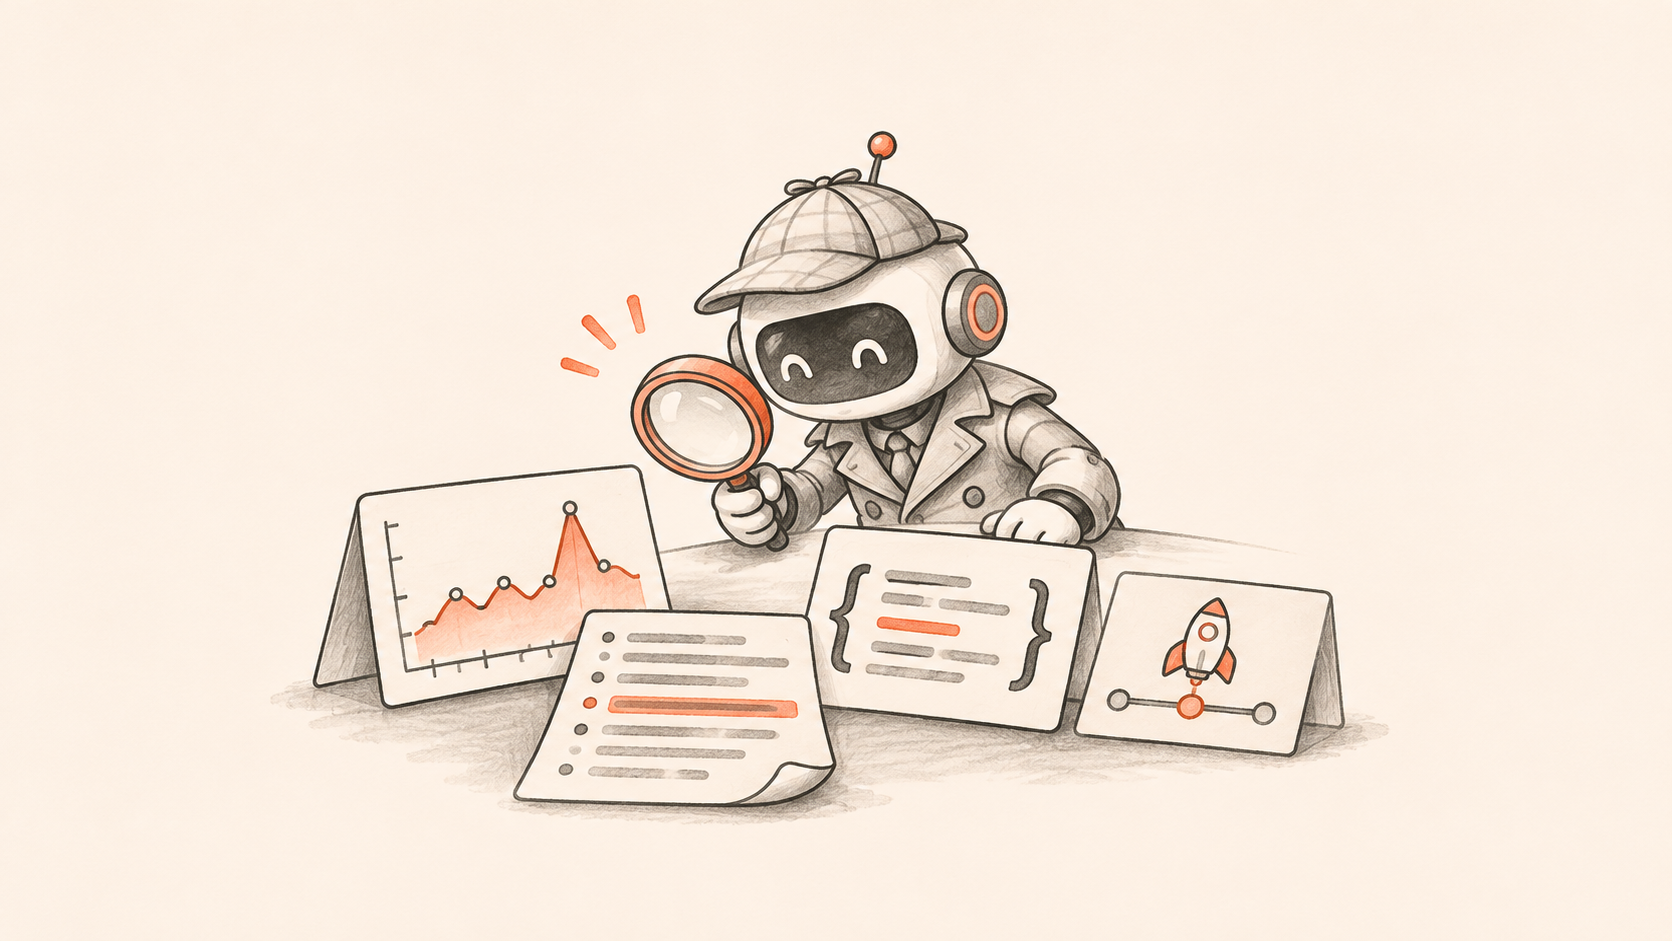

Even with every data source connected, an SRE agent can still chase the wrong lead, take too long, or miss the point. When that happens, the cause is usually how the data is organized. The core rule is simple: keep data consistent and easy for AI to process. You can apply it in three ways: reveal data progressively, keep semantics consistent, and link signals together.
The previous post argued that when an SRE agent investigates poorly, you should first check whether it has all the data it needs. This post picks up from there.
We've seen the same patterns at many teams:
- Metrics, logs, traces, and the CMDB are all connected, but the agent flails across dozens of data sources and takes 20 queries to find the right service's logs.
- The service is
order-apiin logs,order_servicein metrics, and "Order Center" in the CMDB, and the agent can't tell they're the same thing. - An hour of raw logs goes straight into the context window, burying the few critical error lines under hundreds of thousands of normal requests.
These aren't model problems. A senior SRE on their first day would make the same mistakes with the same data. Long-tenured engineers fill the gaps with tacit knowledge: they know where each service's logs live, that two names refer to one service, and which dashboard to open first. An agent has none of that. It only knows what you give it.
Give a map first, then the details
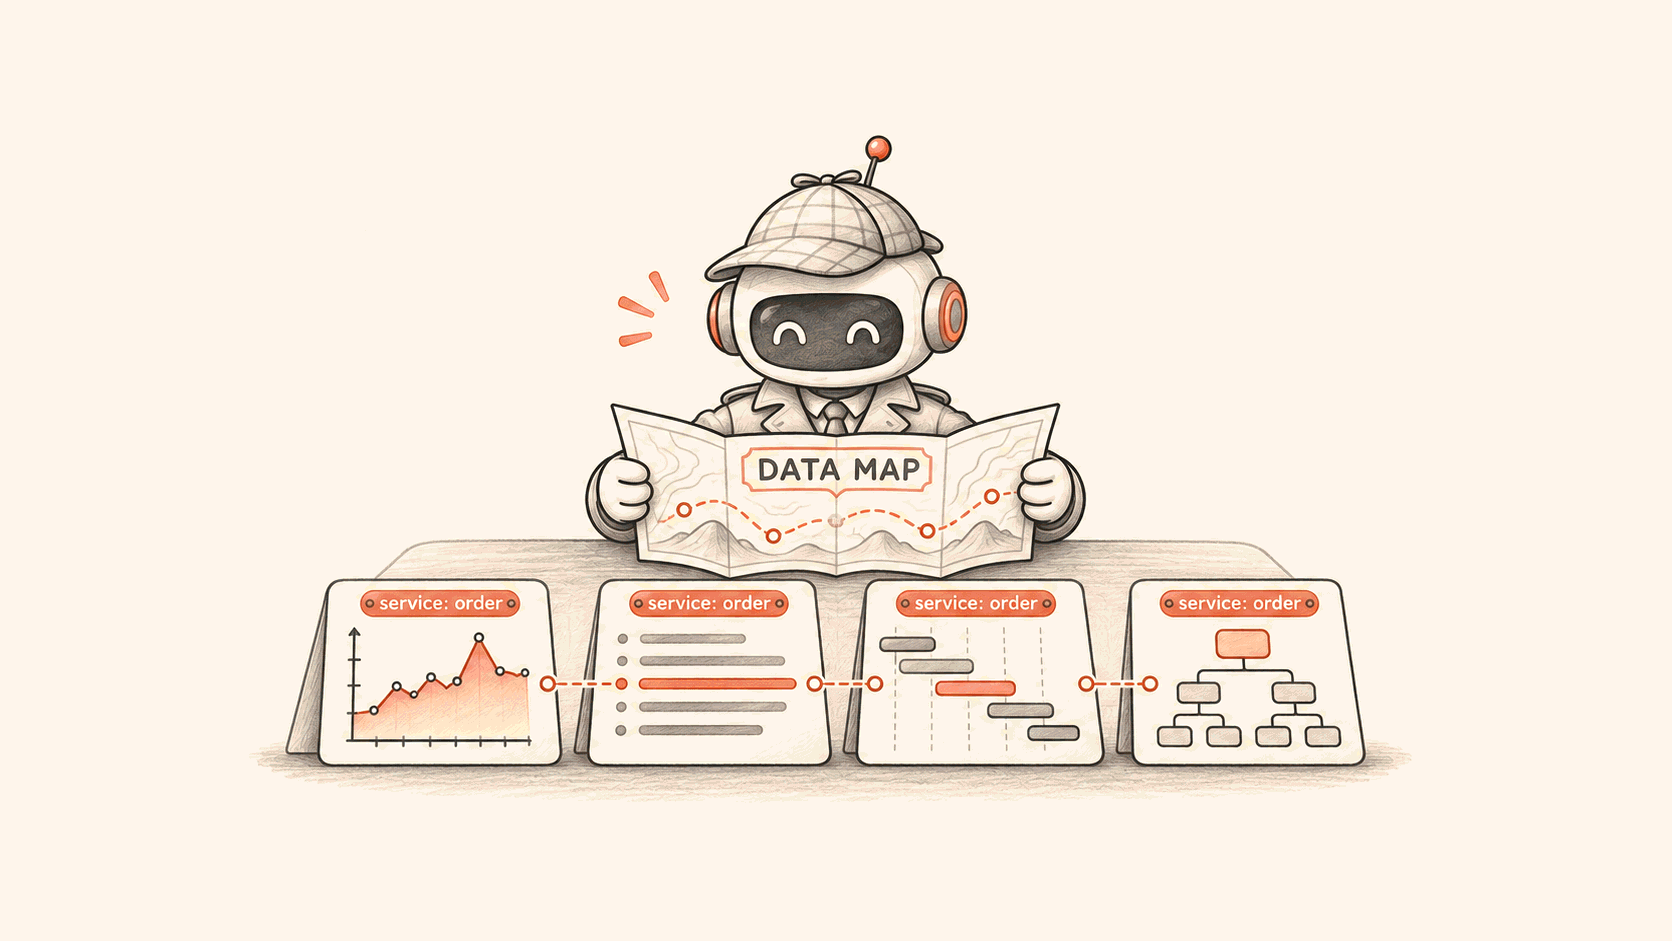
Provide a data map
When you investigate an incident, you probably don't start by reading logs. You check the high-level dashboards, narrow down to a suspect service, and then drill into its metrics and logs. An agent should work in the same order.
So the first step is to give the agent a data map and an overview that covers:
- Which data sources exist and where each kind of data lives.
- Which fixed filters to apply when querying each service.
- Which dashboards matter most.
The map doesn't need to be long. One page of Markdown is enough. It points the agent in the right direction from the start, so it doesn't fumble through data sources by trial and error.
Trial and error is expensive. Every wasted query consumes context. The more the agent queries, the more likely earlier useful findings get pushed out, and the shakier the final conclusion becomes.
Compress raw data into features with algorithms
The second step is to extract features with algorithms before the agent sees the data, rather than handing it raw data.
Take metrics. A single time series can have thousands of points. Feeding them to the agent burns tokens, and models aren't good at reading trends from a long list of numbers. A better approach is a metrics_trend tool that returns processed findings: the baseline, when the change started, how large it was, and which dimensions (which instance or endpoint) drove most of it.
The same goes for logs. An hour can produce hundreds of thousands of lines. A log_pattern tool can cluster them into templates, return each template's count and first occurrence, and compare them against a baseline period before the incident. A finding like "a new connection refused template appeared 5 minutes before the alert, with 3,000 occurrences" is far more useful than 3,000 raw log lines.
The division of labor is clear. Algorithms handle computation, clustering, and comparison, because they're fast and precise. The model handles reasoning, correlation, and conclusions, because that's what it's good at. Asking a model to count plays to its weaknesses.
Give each thing one name
Standardize naming
The same monitored object should have the same name in every data source. The service label on metrics, the service field in logs, the service name in traces, the service ID in the CMDB, and the labels on alert events should ideally all share one value.
Label keys need to match too. One system says service, another app, another app_name. One environment is prod, another production. You can tell at a glance what they mean. The agent has to guess, and when it guesses wrong, it queries the wrong service.
If you're not sure what conventions to adopt, use the OpenTelemetry semantic conventions, such as service.name and deployment.environment.name. They're an established, widely used standard, and models have seen plenty of data that follows them during training, so they're the easiest for a model to understand.
Beyond names, two details are easy to overlook:
- Time. Inconsistent time zones across systems are a subtle trap during investigations. If logs use local time and metrics use UTC, the agent can easily misalign the timeline by hours (8 hours for a team in China). Use timestamp formats that include the time zone everywhere.
- Units. Is latency in milliseconds or seconds? Is memory in bytes or MB? Adding unit suffixes to metric names, such as
_secondsand_bytes, prevents many misreadings.
Cover legacy naming with Knowledge
Legacy systems are hard to rename all at once. When you can't change them, describe the mapping in Knowledge: order-api, order_service, and "Order Center" are the same service, its logs live in a given logstore, and you filter by a given field.
It's a fallback, but it works. Reading a short mapping note costs the agent very little and is far more reliable than letting it guess.
Build a global service catalog
One level up, build a global service catalog: which services exist, and each one's responsibilities, owners, dependencies, deployment location, and data entry points. The catalog is the skeleton the agent uses to understand your whole system.
Many companies don't have a structured CMDB, or the data in theirs went stale long ago. That's fine. Start by writing the catalog as a Markdown file for the agent, and it'll solve most of the problem. Don't put this off while you wait for a perfectly structured system. A well-maintained Markdown file beats a CMDB nobody maintains.
Make every signal lead to the next
Attach investigation leads to alerts
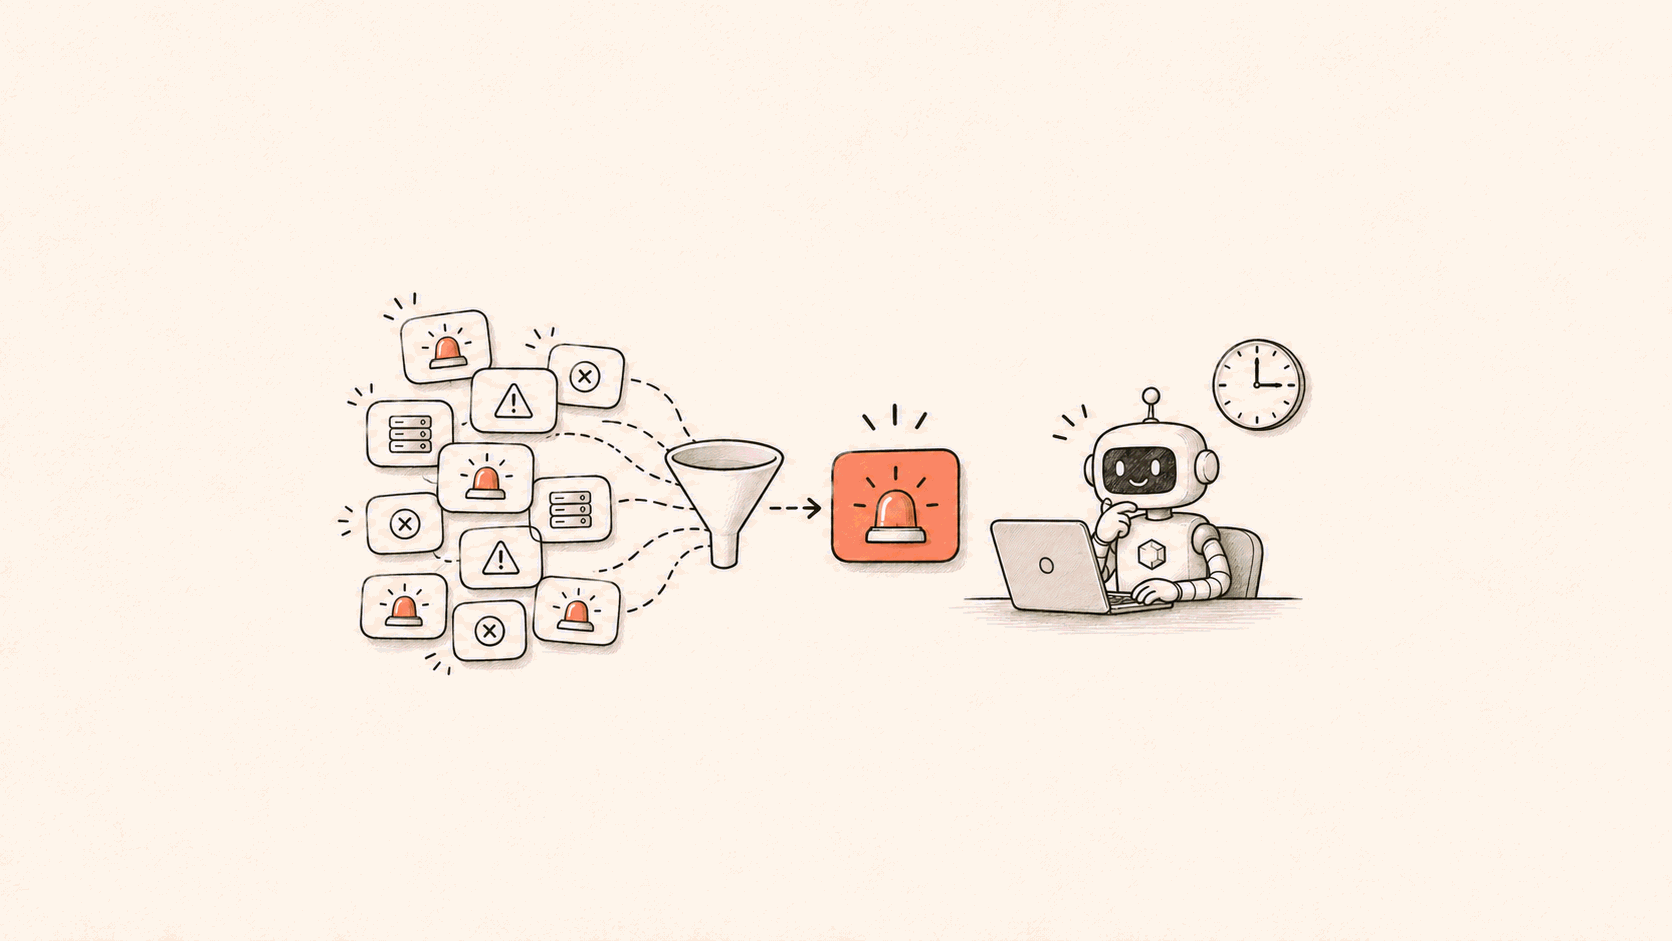
Alerts are where the agent starts. If an alert only says "Error rate for service XX is above 5%," the agent has to find every lead from scratch.
Instead, attach three things to each alert rule:
- A standard operating procedure (SOP): how to investigate this kind of alert and what to check first.
- Ad hoc queries: the queries you usually run, such as error rate broken down by endpoint or error logs for the time window.
- Dashboard links: the service's key dashboards.
These help your on-call engineers, and they help the agent even more. They turn an alert into an investigation entry point that comes with leads, so the agent can follow them instead of exploring blind.
Link logs to traces and metrics
For logs, a few specific recommendations:
- Log the trace ID. With a trace ID, the agent can jump from an error log to the full call chain and see which hop failed.
- Use JSON. Structured logs can be filtered and aggregated by field without a pile of regular expressions.
- Use canonical log lines. Stripe popularized this practice: at the end of each request, emit one wide log line with the request's key details, such as endpoint, user, duration, status code, number of downstream calls, and database time. One line gives the full picture of a request, so nobody has to piece it together from dozens of scattered lines.
- Keep log fields consistent with metric labels. Use the same keys and values for
service,endpoint, andregionin logs as in metrics. When the agent spots an anomalous endpoint in metrics, it can query logs with the same conditions without any translation.
Change events work the same way. Deployment and configuration change records should carry the same service labels. When a service has a problem, the agent can immediately connect it to that service's recent changes.
The goal of linking signals is that, from any starting point, the agent can follow shared identifiers to every related piece of data. Alerts link to dashboards and queries, metrics link to logs, logs link to traces, and services link to changes.
Test your data with past incidents
To check how well your data is organized, have the agent investigate a past incident, then review how it worked.
Don't just check whether the conclusion was right. Look at which tools it called and which data it queried along the way:
- If it queries the same data source over and over with different filters, your data map has gaps.
- If it finds the metrics but can't find the matching logs, your fields aren't aligned.
- If it digs back and forth through raw data, you're missing feature-extraction tools.
Wherever the agent gets stuck is where your data has a gap. That's more accurate than any checklist.
These practices help people too
None of these practices was invented for AI. Consistent naming, structured logs, trace IDs, service catalogs, and alerts with runbooks have been observability best practices for years. Engineers' experience used to paper over the gaps, so teams could get by without them. Now that an agent does the investigating, that debt comes due.
The work pays off for people too. New hires ramp up faster, on-call gets easier, and postmortems go more smoothly.
So the next time your SRE agent misses the mark, ask whether it has all the data. Then ask one more question: could a new hire make sense of this data?
Learn more about and try Flashduty AI SRE.