

If your SRE agent gives vague incident analyses, check whether it can access the evidence it needs before switching models or rewriting prompts. A model can't investigate data it can't see.
We've heard this complaint from teams discussing SRE agents: “The AI isn't very good at troubleshooting. Its conclusions are so generic they don't tell us anything.” Changing the model or tuning the prompt can help, but start by asking whether you've given the agent enough context.
Imagine asking an experienced site reliability engineer to investigate an incident with only an alert. Without metrics, logs, code, or information about recent deployments, that engineer might also fall back on advice like “check the database connections.” Today's leading models have considerable reasoning ability, but reasoning alone can't replace evidence.
Connecting the necessary data is a first step in building an SRE agent. The Flashduty AI SRE integrations page shows the range of sources involved:
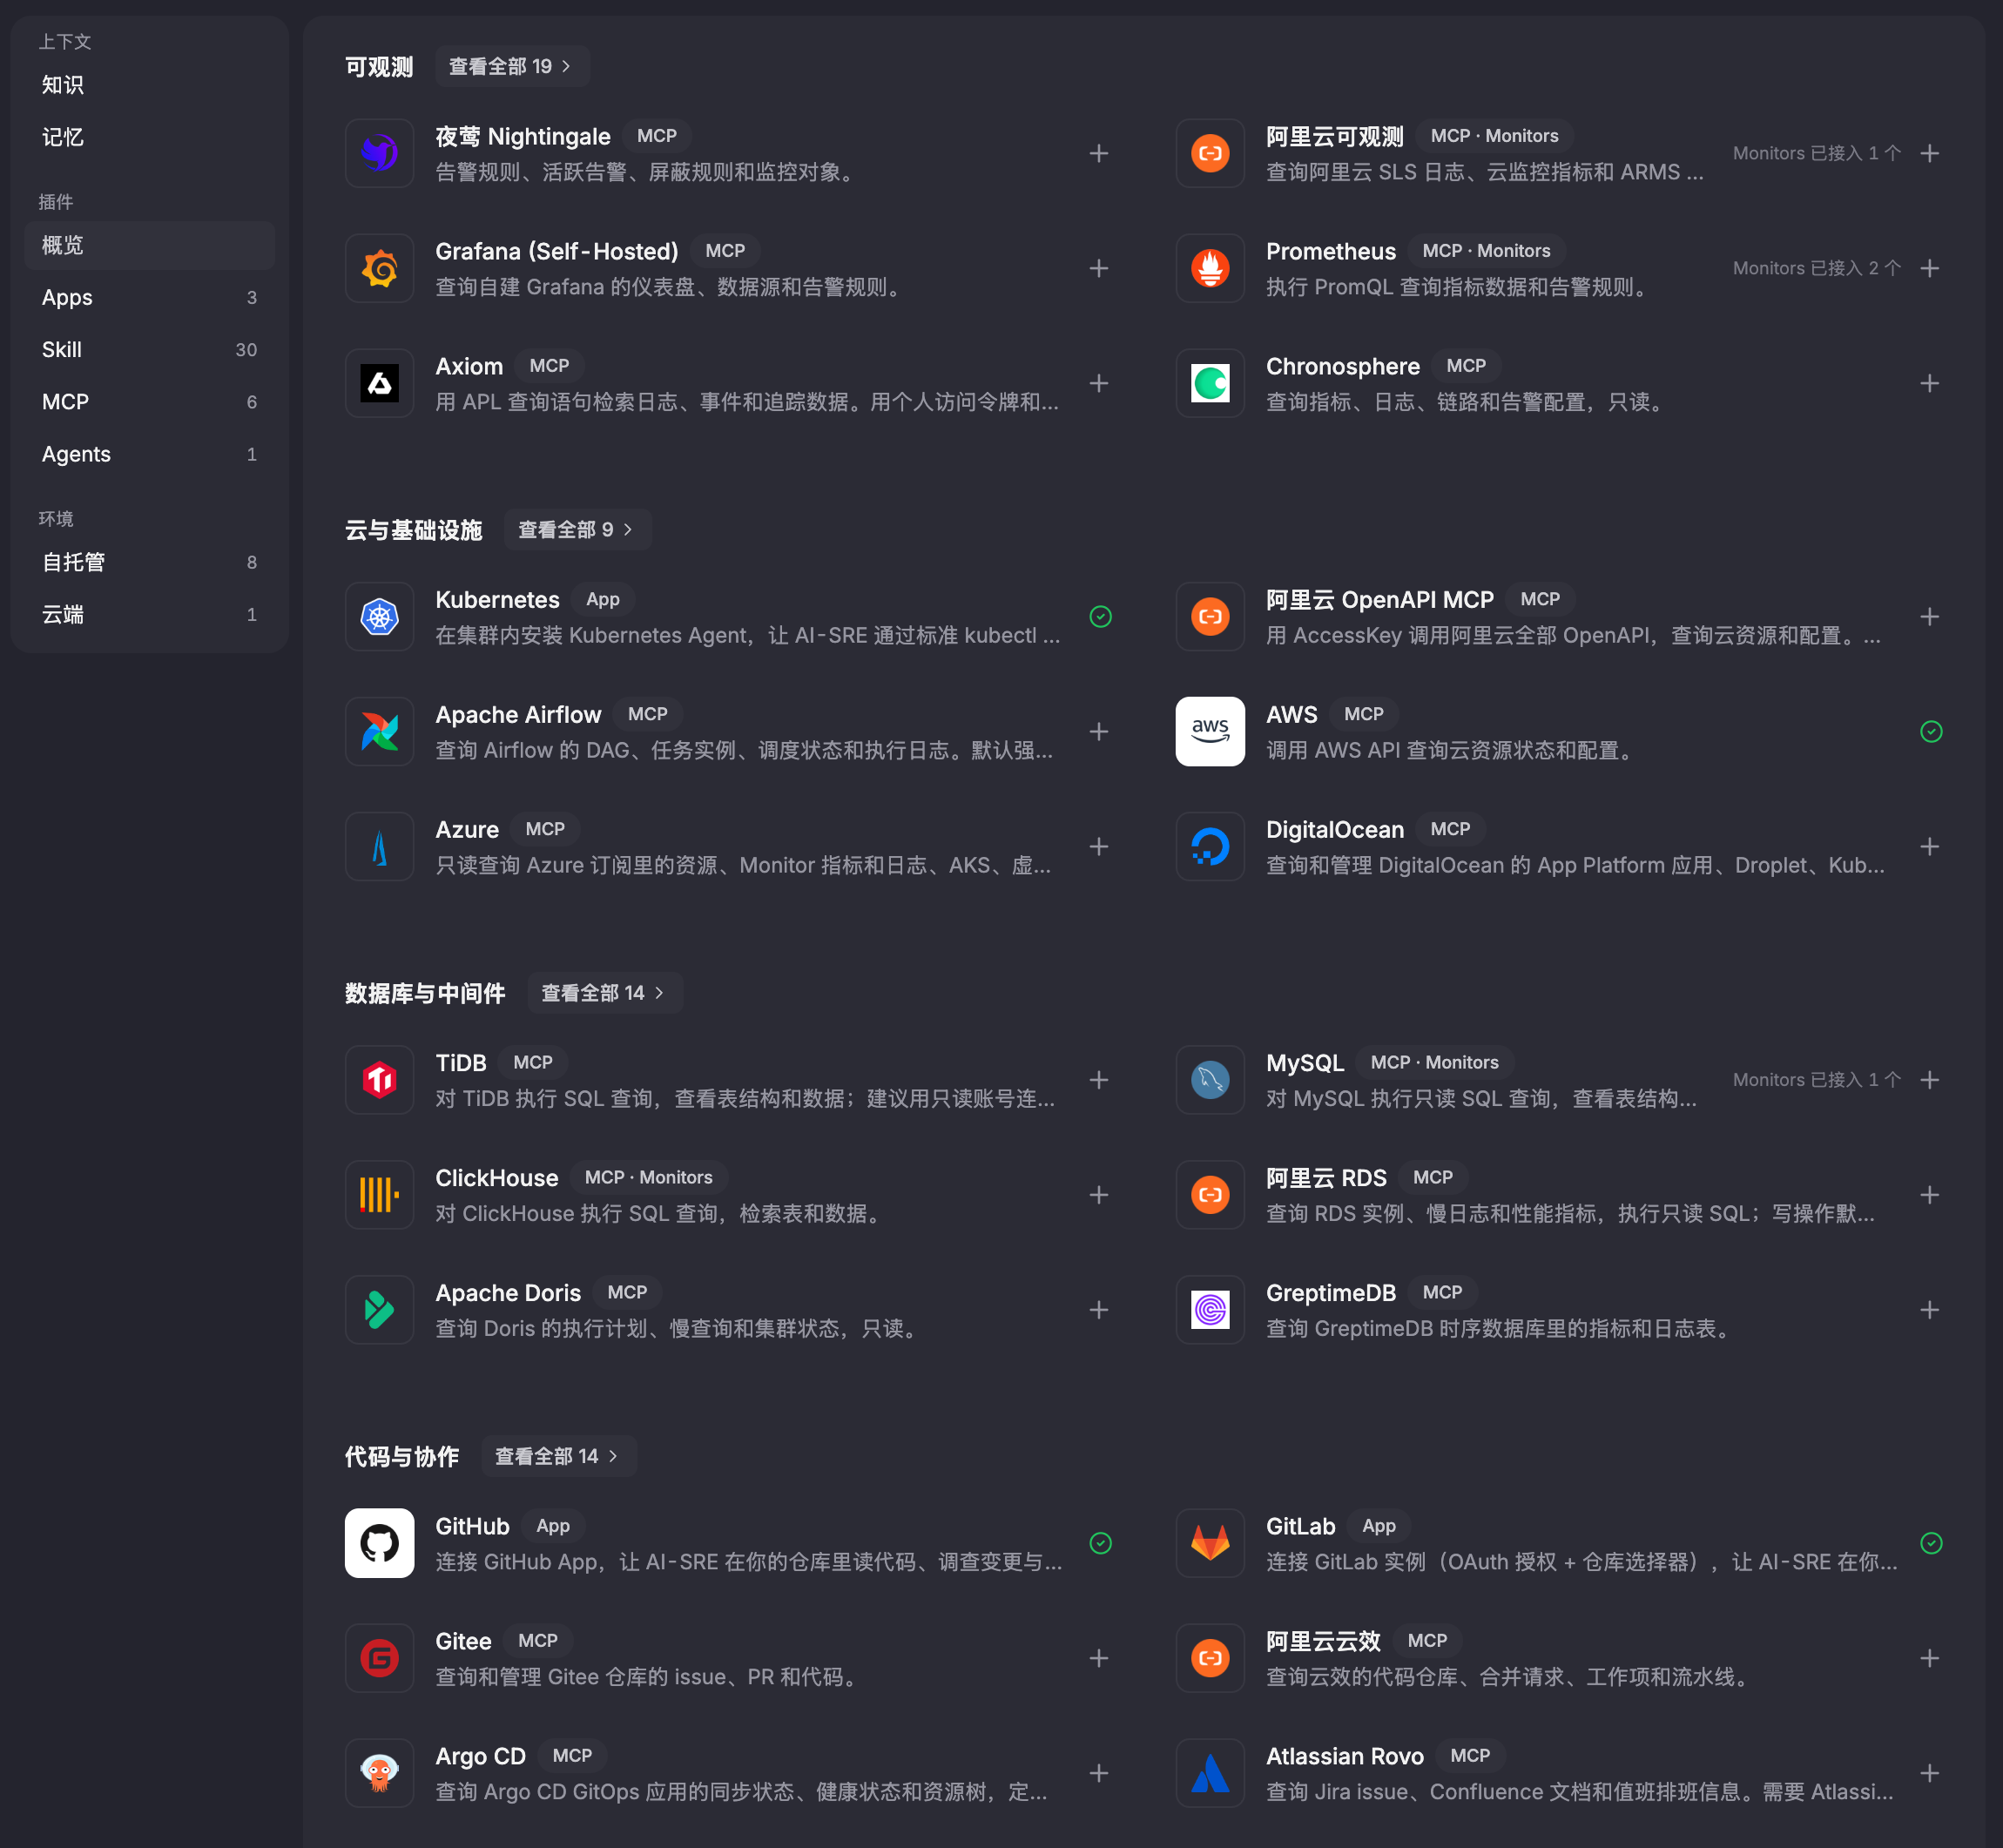
Based on our experience, here are the sources to consider.
1. Alerts and incidents
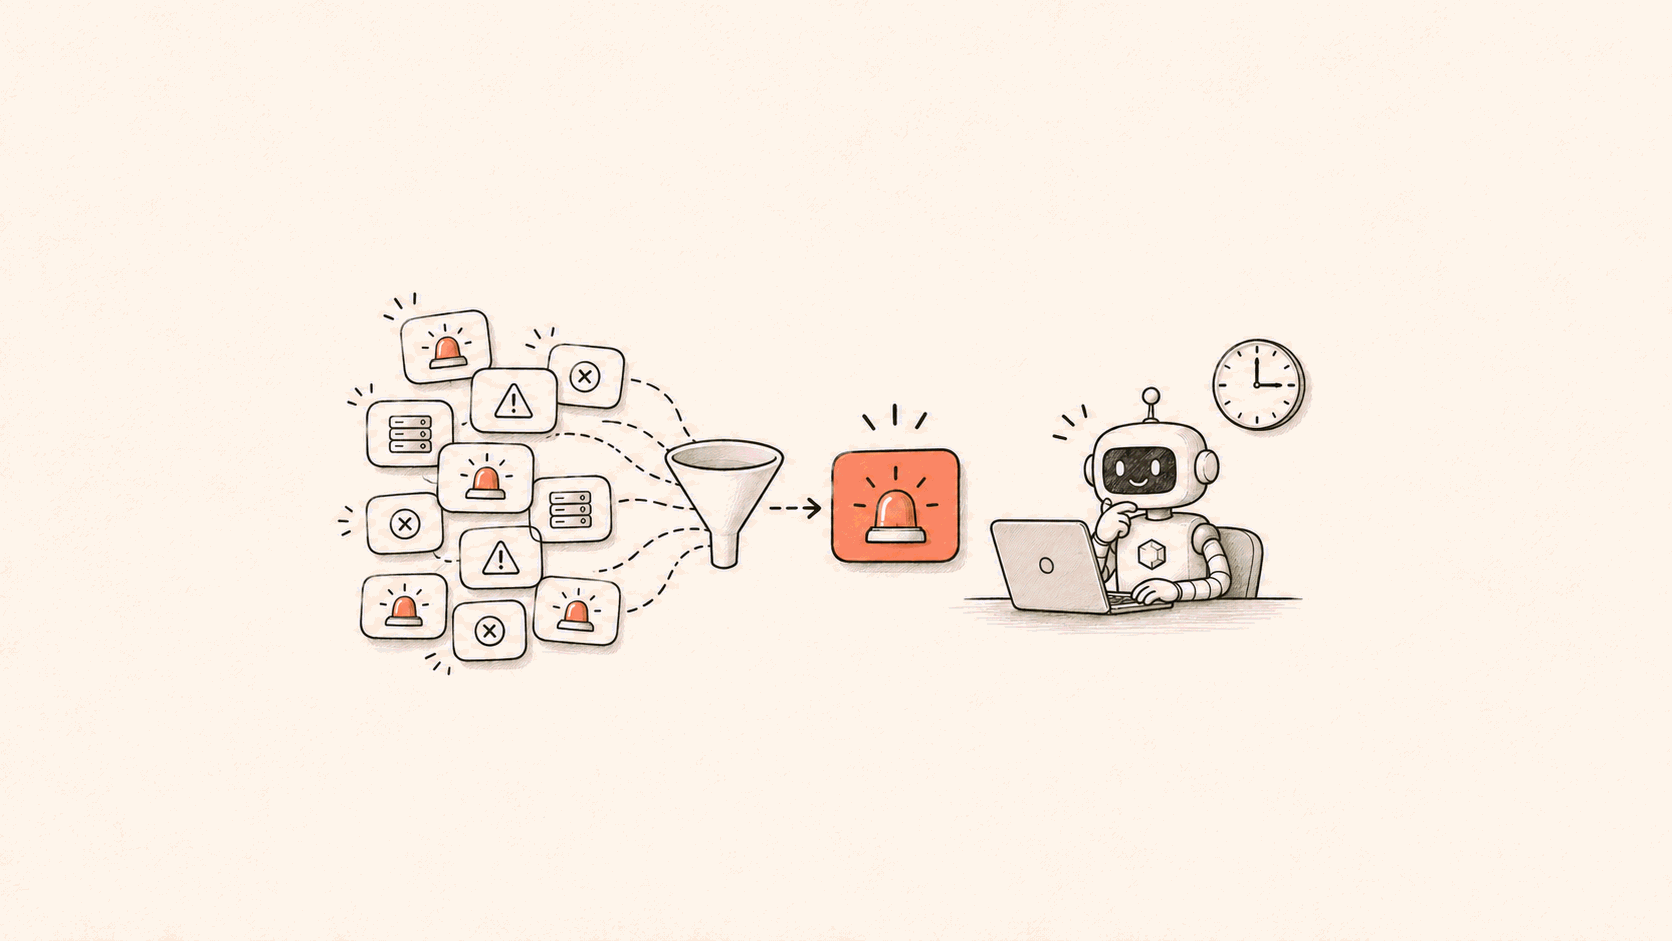
Alerts are the starting point for an investigation. Give the agent access to the current incident, historical incidents, and postmortems. Many incidents are old problems returning in a different form.
Event quality matters too. Accurate timestamps and labels for the service, region, cluster, and instance help the agent find relevant metrics and logs. Links to investigation tools and runbooks provide additional leads. For how to govern the alerts themselves, see Fix your alerts first.
2. Observability data
Metrics, logs, traces, and profiles are the obvious sources. Connecting them is only part of the work. The agent also needs to know which data source holds each dataset and which filters to apply for each service.
For example, an engineer may know which logstore contains a service's logs and which app field to filter on. The agent won't know unless you tell it. Without that information, it can query plenty of data from the wrong service.
3. Live state
Some high-cardinality data changes quickly and isn't suited to storage in an observability data warehouse. Examples include current MySQL lock waits, connection lists, and slow SQL queries currently running.
The agent needs to fetch this information during the investigation. Monitoring charts may show that a database has a problem; live state can show which connection or query is responsible.
4. Configuration management database
A configuration management database (CMDB) can contain the service catalog, service metadata, dependencies, host information, and network topology.
This context helps the agent place an alert within the wider system: who owns the service, what it depends on, what depends on it, and where it runs. Without it, the agent is left examining one component in isolation.
5. Kubernetes
The agent needs access to workload configuration, pod status, Kubernetes events, and similar information. In practice, read-only kubectl access is the goal. A Kubernetes App integration or a direct Model Context Protocol (MCP) connection is generally enough. The Kubernetes App has the cluster dial out, so you never open an inbound port; see Safe cluster access for AI SRE.
6. Cloud providers
When services run in the cloud, the underlying resources can be involved in an incident: an RDS instance may reach its capacity, a load balancer may behave unexpectedly, or an availability zone may experience disruption. The agent needs to read cloud resource data through the provider's command-line interface or MCP.
7. Changes
Changes deserve special attention. Many incidents follow a change, and “what changed recently?” is often one of the most useful questions in an investigation.
The scope is broader than application deployments. Connect records for binary releases, configuration changes, feature flags, database schema changes, ingress changes, and network changes wherever possible.
8. Code
Code operates at a lower level of abstraction than documentation, but it's a source of truth. Higher-level documentation can be incomplete or out of date.
Reading code during an incident used to be too slow to be practical in many cases. AI can now make it feasible: checking the code can explain what an error message means. Flashduty offers GitHub App and GitLab App integrations so AI can read repositories without relying on a local checkout; see GitHub and GitLab Apps for AI SRE.
9. Knowledge and skills
There's a counterintuitive point about knowledge and skills: as models become more capable, they need less extensive instructions.
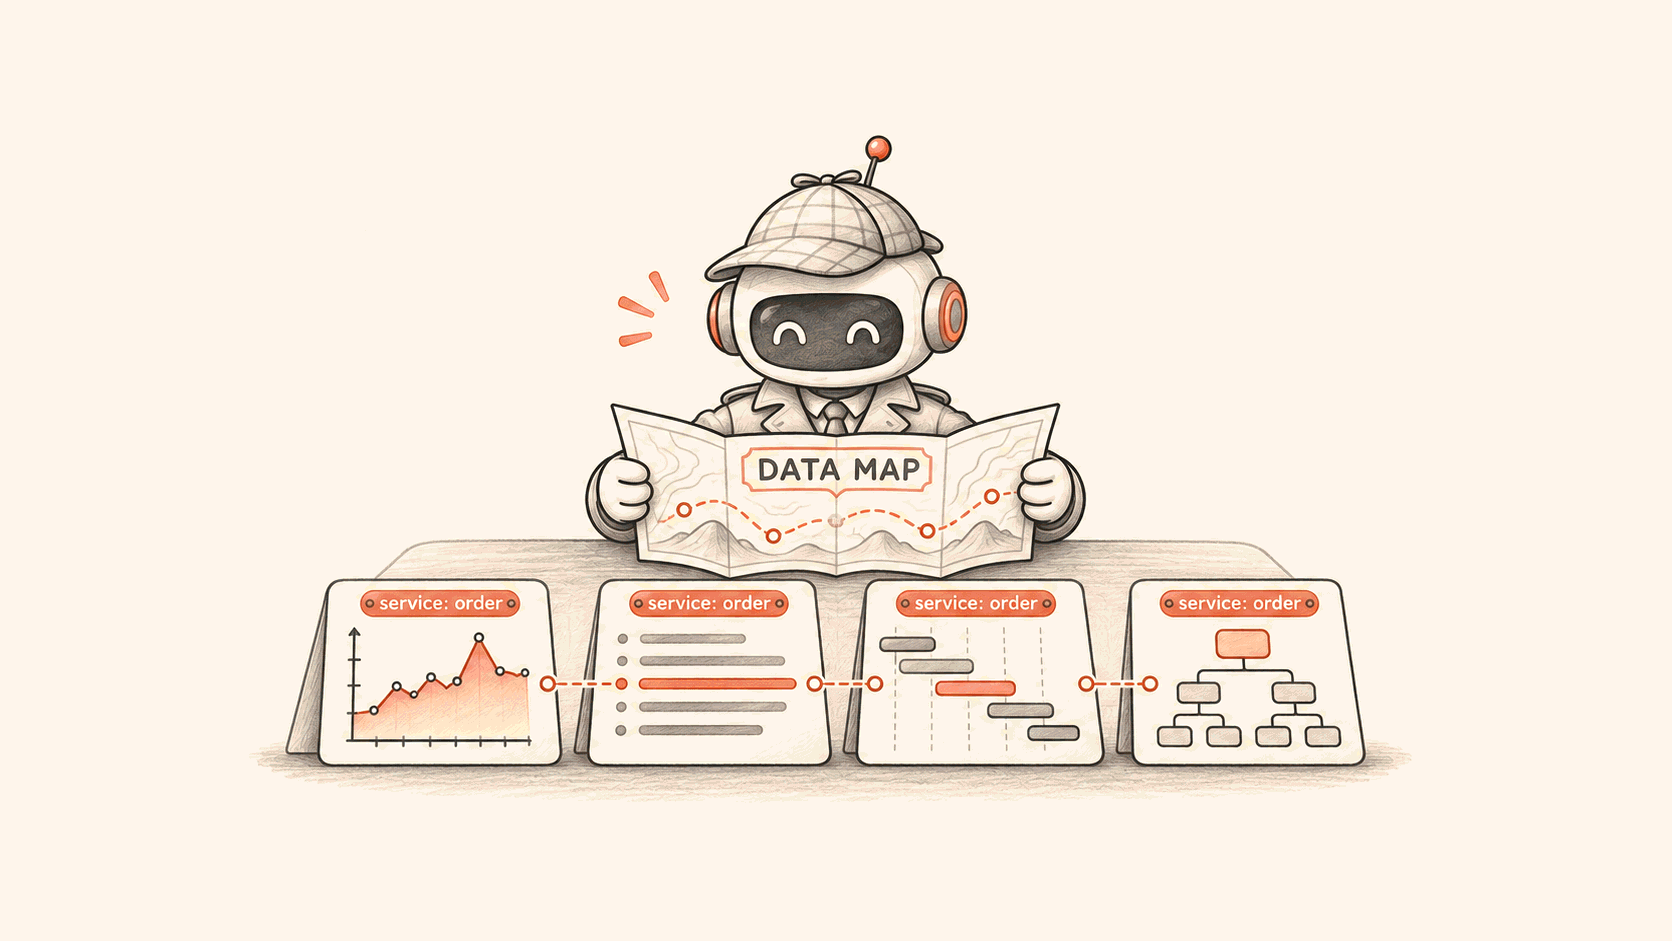
You don't need to write an exhaustive troubleshooting manual for every scenario. Two things are more useful: investigation principles, such as “check changes before resources,” and a high-level data map that tells the agent where to find each kind of information. You can also provide a service catalog as Markdown.
Check access to the evidence
This list closely resembles what an experienced SRE would consult during an investigation. The agent needs access to the same evidence.
The next time an SRE agent falls short, use the list to ask: could it access the evidence that mattered for this incident? If it couldn't, the missing context may explain the result.
Once the data is connected, how you organize it matters just as much; see Your SRE agent has the data. Is it organized?.
For why incident investigation needs a dedicated SRE agent rather than a general-purpose one, see We already have Codex and Cursor. Why do we need an SRE agent?.
Learn more about and try Flashduty AI SRE.