
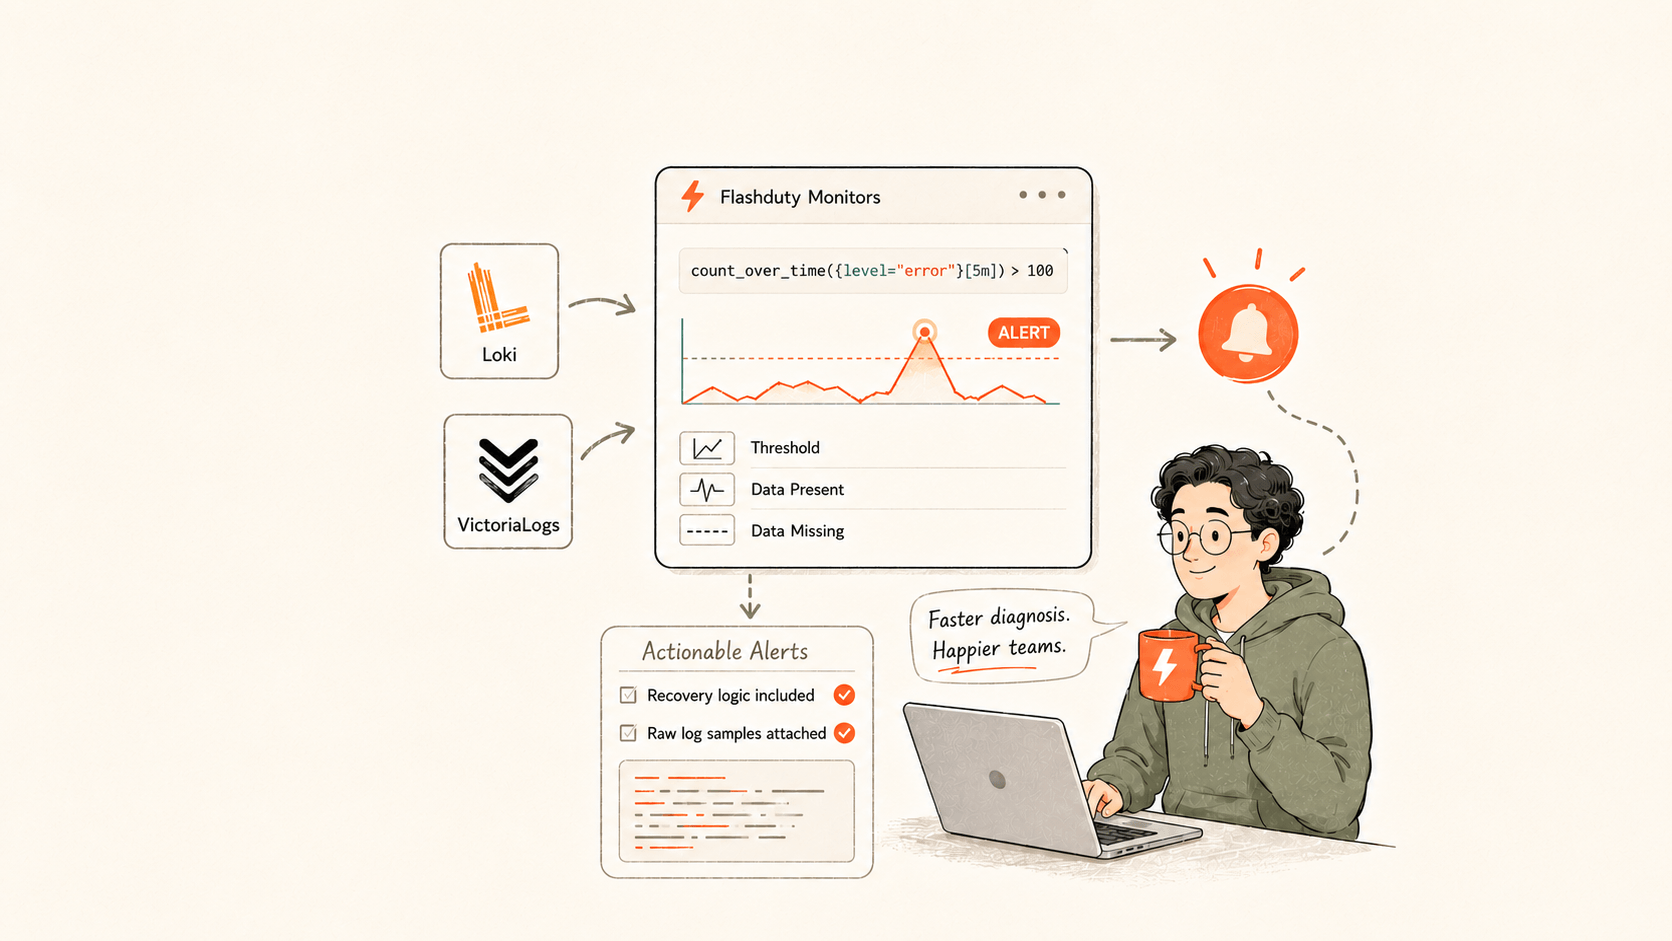
Flashduty Monitors adds two data sources: Grafana Loki and VictoriaLogs. You can alert on the LogQL or VictoriaLogs queries you already use, with no new query language to learn. Flashduty handles alerting, recovery, notification, and on-call. The alert can also include the log line that triggered it.
If you can already search your logs, the hard part is the next step: turning logs into alerts. Who should get notified? Which log line goes in the notification? When does the alert count as recovered? This post covers alerting modes, recovery options, and three rules you can copy.
Use native query syntax
Monitors accepts LogQL and VictoriaLogs queries without changes.
Loki LogQL example:
count_over_time({job="mysql"} |= "error" [5m])VictoriaLogs example:
_time:15m and level:ERROR | stats by (level) count(*) total | filter total:>10Three alerting modes
| Mode | Best for | Example |
|---|---|---|
| Threshold evaluation | Multi-level alerts such as Info, Warning, and Critical | Trigger Critical when error logs exceed 50 in 5 minutes |
| Data exists | Alert as soon as abnormal data appears | Trigger immediately when any HTTP 500 error appears |
| Data missing | Monitoring log-pipeline health | Alert when an Agent stops reporting logs |
For log alerts, start with Data exists mode. Put the filter in your Loki or VictoriaLogs query. If the query returns data, Flashduty triggers an alert.
Three ways to recover
- Automatic recovery. The alert recovers when the value drops below the threshold.
- Recovery threshold. Set a separate condition, such as
$A < 5. When the value fluctuates near the threshold, the alert stays stable instead of firing and recovering repeatedly. - Recovery query. Use a second query to decide recovery, with
${label_name}variable substitution. Use it when alerting and recovery need different queries, such as for switch interface status changes.
# Alert query: search error logs
count_over_time({job="mysql"} |= "error" [5m])

# Recovery query: search recovery marker logs
count_over_time({job="mysql"} |= "recovered" [5m])
Include the log line in the alert
When a log alert fires, the responder first needs to know which log line triggered it.
Set up an associated query and render its result in the rule's note template. The alert message then includes a raw log sample:
error log count: 23.000
Loki log time: 2026-01-09T10:23:45+08:00
Loki Log line: [ERROR] Connection refused to database server 10.0.1.5:3306
The responder gets a first clue for the investigation, rather than only a "log anomaly" message.
For setup steps, see Loki alert rule configuration and VictoriaLogs alert rule configuration.
Three rules you can reuse
Rule 1: application error logs (Loki). Trigger Warning when error logs exceed 10 in 5 minutes, and Critical when they exceed 50.
count_over_time({job="myapp"} |= "error" [5m])Set the thresholds to Warning $A > 10 and Critical $A > 50.
Rule 2: HTTP 500 errors (VictoriaLogs). Alert as soon as one appears. Choose Data exists mode, so any returned data triggers an alert.
_time:5m and status:500 | stats by (service) count(*) total | filter total:>0Rule 3: log collection health. Alert when a host hasn't sent logs for more than 15 minutes. That gap may mean the collector stopped. Choose Data missing mode, so continued absence of data triggers an alert.
# Loki
rate({job="node-logs"} [1m])
# VictoriaLogs
_time:15m | stats by (host) count(*) totalFlashduty handles the response
Loki and VictoriaLogs remain your log engines. Flashduty handles the response:
- Native LogQL and VictoriaLogs rules
- Edge deployment for logs in private networks
- Recovery logic
- Raw log samples in notifications
- Grouping and suppression
- 20+ notification channels, including Feishu, DingTalk, WeCom, Slack, and PagerDuty
- 24/7 on-call schedules
To try it, sign up for Flashduty for free and create a Loki or VictoriaLogs rule.