
An automation lets AI SRE start working without anyone asking it to — and it keeps hours humans don't: your 09:00 job starts at 09:03, and a Critical at 03:00 gets picked up all the same.
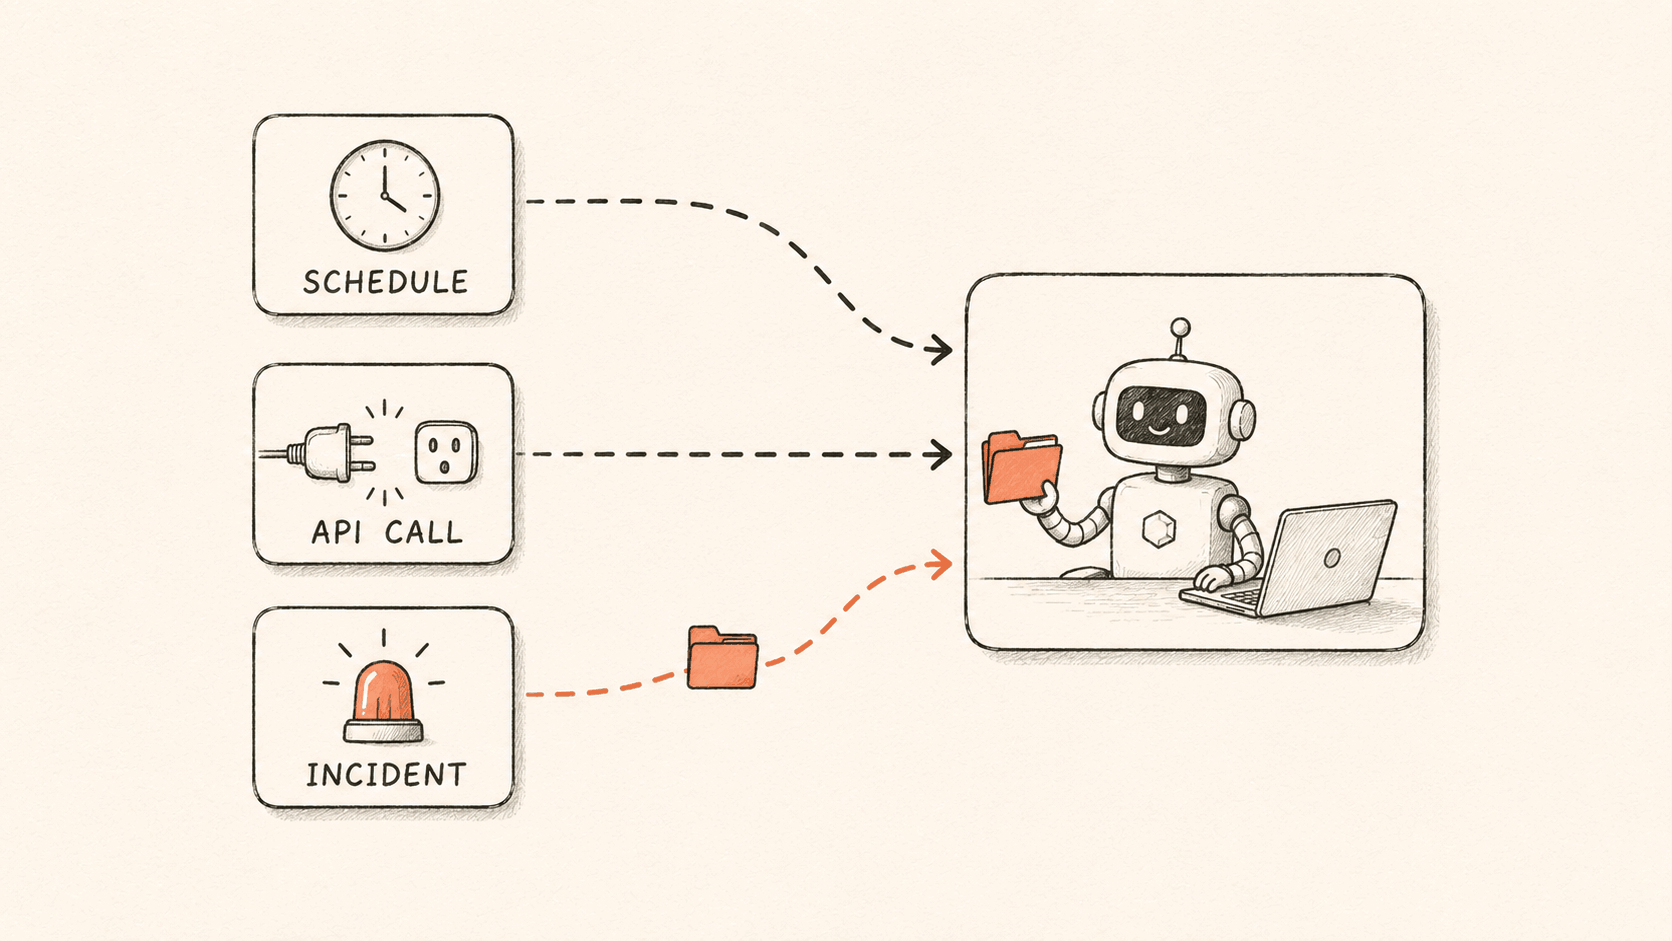
One automation is one rule: a task prompt plus at least one way to start. There are three ways to start: run on a schedule — hourly, daily, weekly, or a cron expression you write yourself; call via API — you get a URL and a token and can POST to it from anywhere; and on-call incident — pick which channels and severities to watch, and a matching incident starts a run. One rule can carry all three at the same time. The prompt does not change; only the thing that wakes it up does.
When a rule starts, it opens a session in the background. That session does not show up in your session list, but the agent works through the prompt with the same tools it has in any other session, and when it finishes you can open the session and read the whole thing: every command it ran, every tool it called, whatever it produced.
Here are five ways to use it. Three ship with the product, so their prompts are already written and you can use them as they are; the last two are examples you can paste and edit. Where each result ends up, at a glance:
| Scenario | Where the result goes |
|---|---|
| 1 · Weekly insights | Stays in the run's session; ask it to publish and it becomes a permanent artifact |
| 2 · Alert governance | Same |
| 3 · Incident analysis | Written back onto the incident as a comment, riding the incident's notifications to whoever is on call |
| 4 · Post-deploy check | The call returns a session_url; post it to the deploy thread or pipeline |
| 5 · Change risk read | The call returns a session_url; paste it onto the change ticket |
1. A weekly report on what actually happened
What it's for. Someone on the team spends a couple of hours every Monday assembling what happened last week: which incidents, which alerts, who carried the pager, what changed. It's the same query every week.
How it starts. Run on a schedule, weekly. Pick a time on Monday morning so the report is waiting when people arrive.
The prompt (ships with the product, as Weekly Insights):
Generate a weekly insights report. Analyze incidents, alerts, response activity,
notification load, and related changes from the past week. Focus on what happened
this week, which signals deserve attention, and which improvement actions are most
valuable. Do not modify any Flashduty business state.
That last sentence matters. The agent can change things in Flashduty, so a reporting automation should say plainly that it shouldn't.
Where the result goes. Into the run's session. Open the rule, open the run, read the report. Want it permanent? Ask it in the prompt to publish the report as an artifact.
2. A standing audit of your noisiest alerts
What it's for. Every team knows some of its alerts are worthless. Almost no team has a ranked list of which ones, and what deleting each would actually save.
How it starts. Run on a schedule. Monthly is enough; this is not a number that moves daily.
The prompt (ships as Alert Governance):
/alert-governance
Produce the alert-governance report for the past 30 days for this scope. Focus on
the alerts most worth fixing and the expected notification reduction. Report only —
do not modify any Flashduty configuration.
The first line is a skill. Automations can invoke skills the same way you can in a chat session, which means the prompt doesn't have to carry the methodology. The skill already has it, and the prompt only says what to point it at.
Where the result goes. Same as the weekly report: into the run's session, and into a shareable artifact if you ask it to publish.
What to know. It reports; it does not fix. Turning the report into changes is still a human decision, on purpose.
3. A first pass at an incident, before anyone opens it
What it's for. A Critical fires in the middle of the night. Whoever is on call only sees it a while later, and the next fifteen minutes go into looking things up: the alerts, the timeline, what shipped recently. That first round of looking things up does not need a human.
How it starts. On-call incident. Choose the channels to watch and tick the severities you care about. A new matching incident starts the run; nobody has to press anything.
The prompt (ships as On-call Incident Analysis):
Analyze the incident that triggered this automation. Use the Flashduty CLI to fetch
incident details, related alerts, and the timeline. Correlate recent changes, alert
context, and existing response notes to judge the likely cause. If evidence is
insufficient, state the uncertainty and recommended next checks.
If you form a useful investigation conclusion, add one summary comment to the
incident. Prefer one complete investigation summary instead of frequent incremental
comments.
Where the result goes. Read that second paragraph again: the conclusion is written back onto the incident as a comment. A new comment rides the incident's assignment policy, so whoever is on call gets notified the usual way and sees the conclusion in the place they were already looking. They don't have to know an automation ran.
The "state the uncertainty" instruction is there for a reason. An analysis that guesses confidently is worse than one that says the evidence isn't there yet and names the next two things to check.
What to know. Only new incidents start a run. Acknowledging, resolving, or reopening one does not. The filter is channels and severities only; you can't match on labels yet. And the same incident starts one run and only one, so a duplicated internal message never turns into three parallel investigations.
4. A check after every deploy
The first three ship with the product. The next two don't. They're examples, and the prompts are ours to write.
What it's for. You deploy, and then you watch dashboards for ten minutes to see whether anything got worse. Most of the time nothing did.
How it starts. Call via API. Add the trigger, save the rule, and you get a URL and a token. The token is shown once. Copy it before you leave the page. After that you can only reset it, which gives you a new token and stops the old one working immediately.
Call it from the last step of your pipeline:
curl -X POST 'https://<trigger URL>' \
  -H 'Authorization: Bearer <token>' \
  -H 'Content-Type: application/json' \
  -d '{"text":"Deployed payment-service v2.14.0 to prod. Changes: retry policy on the settlement callback, new index on t_order.created_at."}'
The text field is appended to the rule's prompt for this run only. This is the one way to get information from outside into the prompt. A scheduled run has no caller to supply it, and an incident-triggered run gets its context from the incident instead.
A prompt to start from:
A deploy just finished; the details are at the end of this message. Compare alert
volume, incident count, and error patterns for the 30 minutes after the deploy
against the same window before it, for the services named. Report only what changed
and whether it plausibly relates to this deploy. If nothing changed, say so in one
line. Do not modify any Flashduty state.
Where the result goes. The call returns immediately. It does not wait for the agent to finish:
{
  "data": {
    "type": "routine_fire",
    "session_id": "<session-id>",
    "session_url": "https://<console>/ai-sre/chat?session_id=<session-id>"
  }
}
Post that session_url into the deploy's chat thread or attach it to the pipeline run. Anyone who wants the detail clicks through to the full investigation.
What to know. A rule accepts one API call a minute. That budget belongs to the rule, so two API triggers on the same rule share it. This is meant for events, not for a polling loop.
5. A risk read before a change lands
What it's for. Change approval is often the one moment when someone asks "has this bitten us before?" Nobody has time to go look.
How it starts. Call via API, from your change-management system when a change moves to approved. Pass the change itself in text.
A prompt to start from:
A change request is described at the end of this message. Look for incidents in the
last 90 days involving the same services or the same kind of change. For each one,
summarize what broke and what fixed it. Then list the specific things worth checking
before and after this change lands. If you find no relevant history, say so plainly
rather than generalizing. Do not modify any Flashduty state.
Where the result goes. Same as the deploy check: the call hands back a session_url, and that link is what you paste onto the change ticket. Whoever approves the change reads the history without leaving the tool they're already in.
If the systems you want to trigger from are already sending data to Flashduty, the integrations list is a good place to see what's connected.
Getting the result to someone
An automation doesn't come with a notification channel, but results reach people in two ways.
Incident-triggered runs borrow the incident's notifications. As covered above, the conclusion becomes an incident comment, and the comment rides the incident's assignment policy to whoever gets paged. There is nothing to configure on this path: however the incident already notifies people is how the comment reaches them.
Other runs: let the agent send it. Scheduled and API-triggered runs don't disturb anyone by default; the result stays in the session. To push it into a group chat, put an IM bot webhook URL in the prompt. Custom bots for Feishu, DingTalk, and WeCom are all just a URL, and the agent POSTs the summary itself when it finishes:
When the task is done, compress the conclusion into a summary of at most 5 lines and
POST it as JSON with curl to this bot URL:
https://open.feishu.cn/open-apis/bot/v2/hook/<your-token>.
If sending fails, say so in the result; do not retry more than twice.
This is how we use it ourselves. Here is the message the agent sent to our DingTalk group after its daily documentation audit finished:
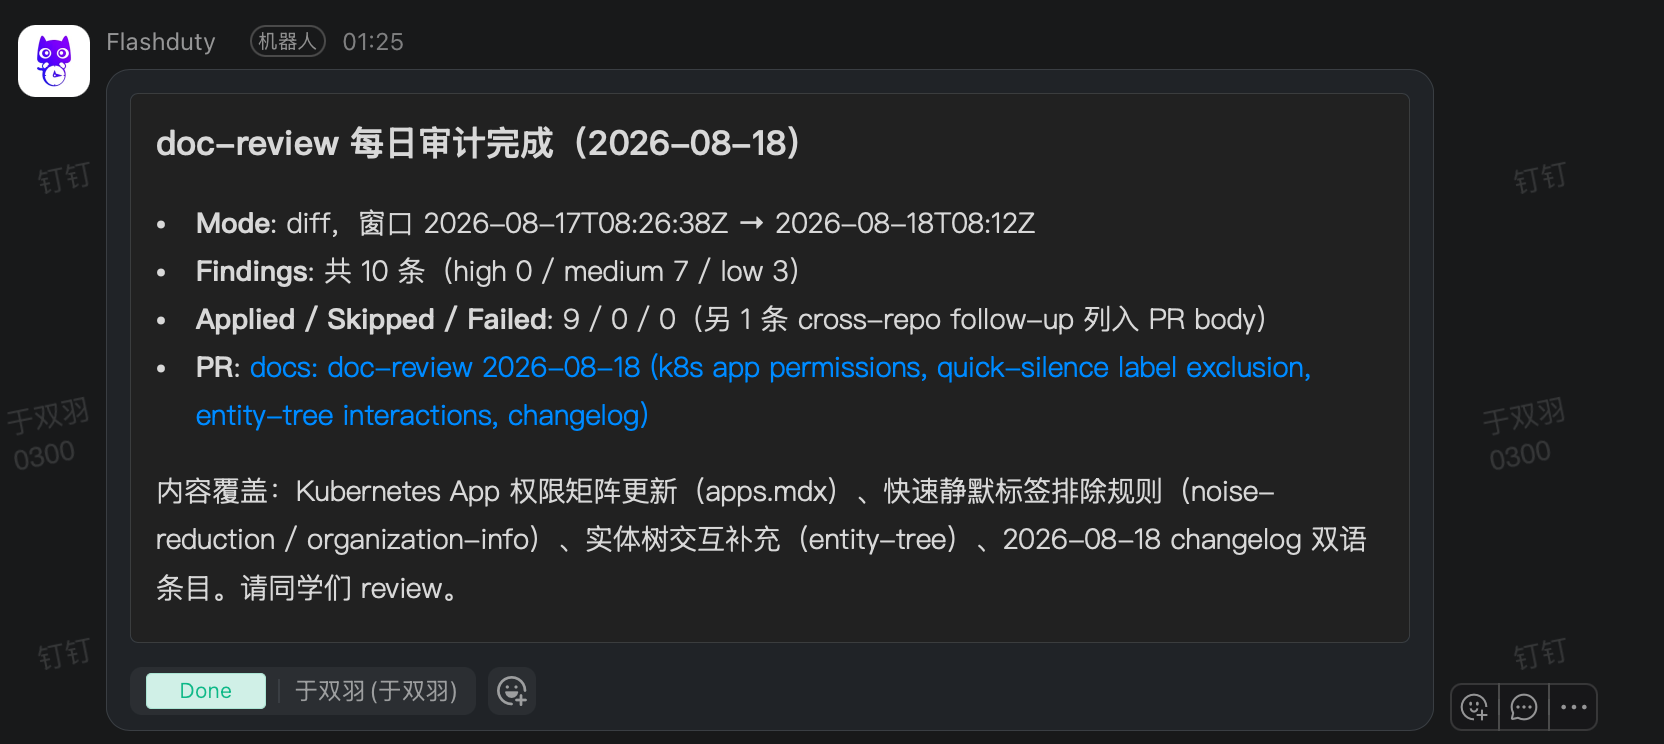
What it audited, how many findings, how many it applied, and where the PR is, all in one message, with links for anyone who wants the detail. A webhook URL in the prompt means anyone who can see the rule can see it too, but a bot like this can only post to that one group, so the exposure is small.
Why the incident one is different
The five above all run the same agent with the same tools. What separates them is not the trigger mechanism. It's what the agent knows at the moment it starts.
A scheduled run starts with your prompt and one other thing: when it last completed successfully. That's enough to pick up where it left off, but it still has to work out where to look. An API-triggered run starts with whatever the caller wrote into text. An incident-triggered run starts with the incident already in hand. Its ID, its channel, and its severity are in the agent's context before its first move, along with an instruction not to go enumerate incident lists trying to work out which one it's meant to be looking at.
That last part sounds minor and isn't. Listing, filtering, and confirming which incident is the target is several rounds of tool calls, and every one of them is a chance to pick the wrong one. Handing the agent the target removes the step entirely.
This is also the part that a schedule can't reach. A rule that runs at 09:00 will tell you about last night's incident at 09:00.
A few things we decided for you
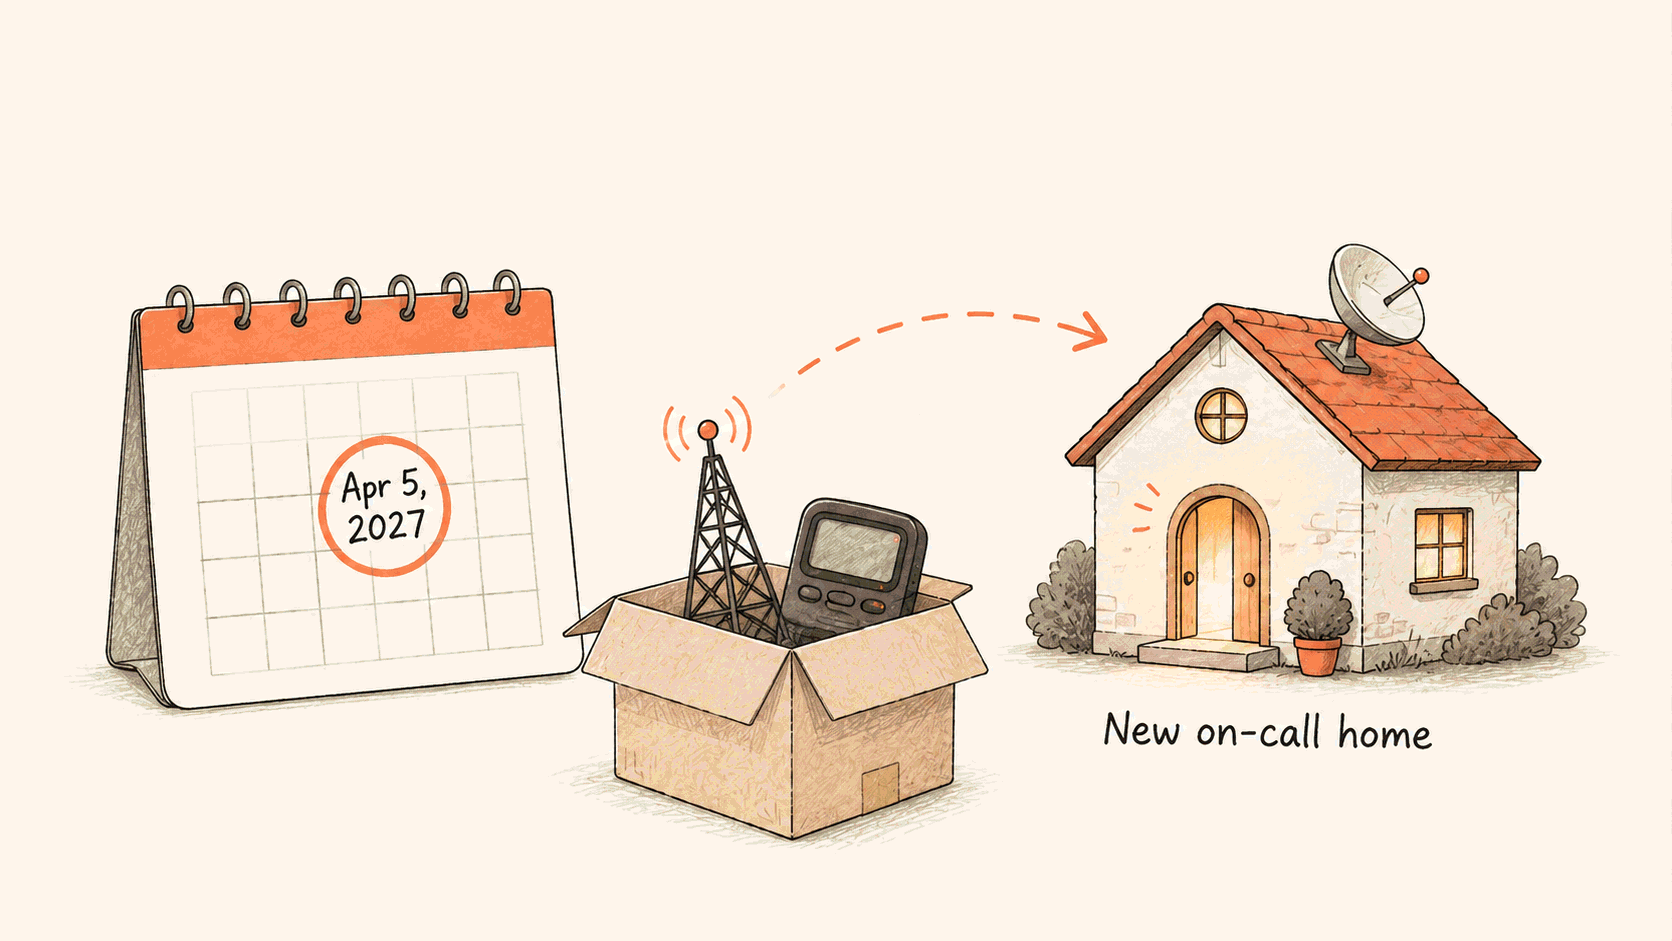
Your 09:00 job may start at 09:03. That's deliberate. If every scheduled job on the platform fired at exactly 09:00:00, none of them would start quickly. Treat these as "every morning", not as a stopwatch.
A run that's still going blocks the next one. If the previous run hasn't finished when the next one is due, the next one is skipped rather than queued. Otherwise a slow job stacks up behind itself.
A missed window expires rather than catching up. If a run is more than a day late, it's dropped. Coming back from an outage to forty queued reports helps nobody.
Restarts don't lose or duplicate a run. Runs in flight survive a service restart, and they're recorded once.
A foreign team's incident is still your rule's incident. If an incident belongs to a different team than the rule does, the run still executes with your rule's permissions. The agent is told so before it starts: this incident belongs to another team, and that team's knowledge was not loaded for this run. It doesn't read across the boundary, and it doesn't silently skip the run either.
Where to start
The page is under AI SRE → Automations in the console. The built-in templates are on the create screen, and this post covers three of them; pick one, change the prompt to match how your team actually works, and set a schedule.
If you want the shortest possible first step: turn on the incident-analysis template for one channel and Critical only. It writes its conclusion where you're already looking, and it's the one that earns its keep at 03:00 rather than at 09:00. Our RUM post walks through one of these end to end, from a user-facing error to a merged fix.
What the agent can actually reach once it starts, the CLI it drives Flashduty with and why it is a CLI, is a separate post. The full field reference for automations, including the cron rules and the trigger payloads, is in the docs. AI SRE is in open beta, and free during the beta.
One caveat about the three built-in prompts: they're the ones we wrote for ourselves, and they assume our habits: a weekly report read on Monday, alert governance as a monthly pass, and a comment on the incident rather than a page as the first thing you want. Your rotation is not ours. Treat the prompts as text to rewrite, not as settings to accept.