Now

Featured

DeepSeek Status Page Migration: From Atlassian to Flashduty

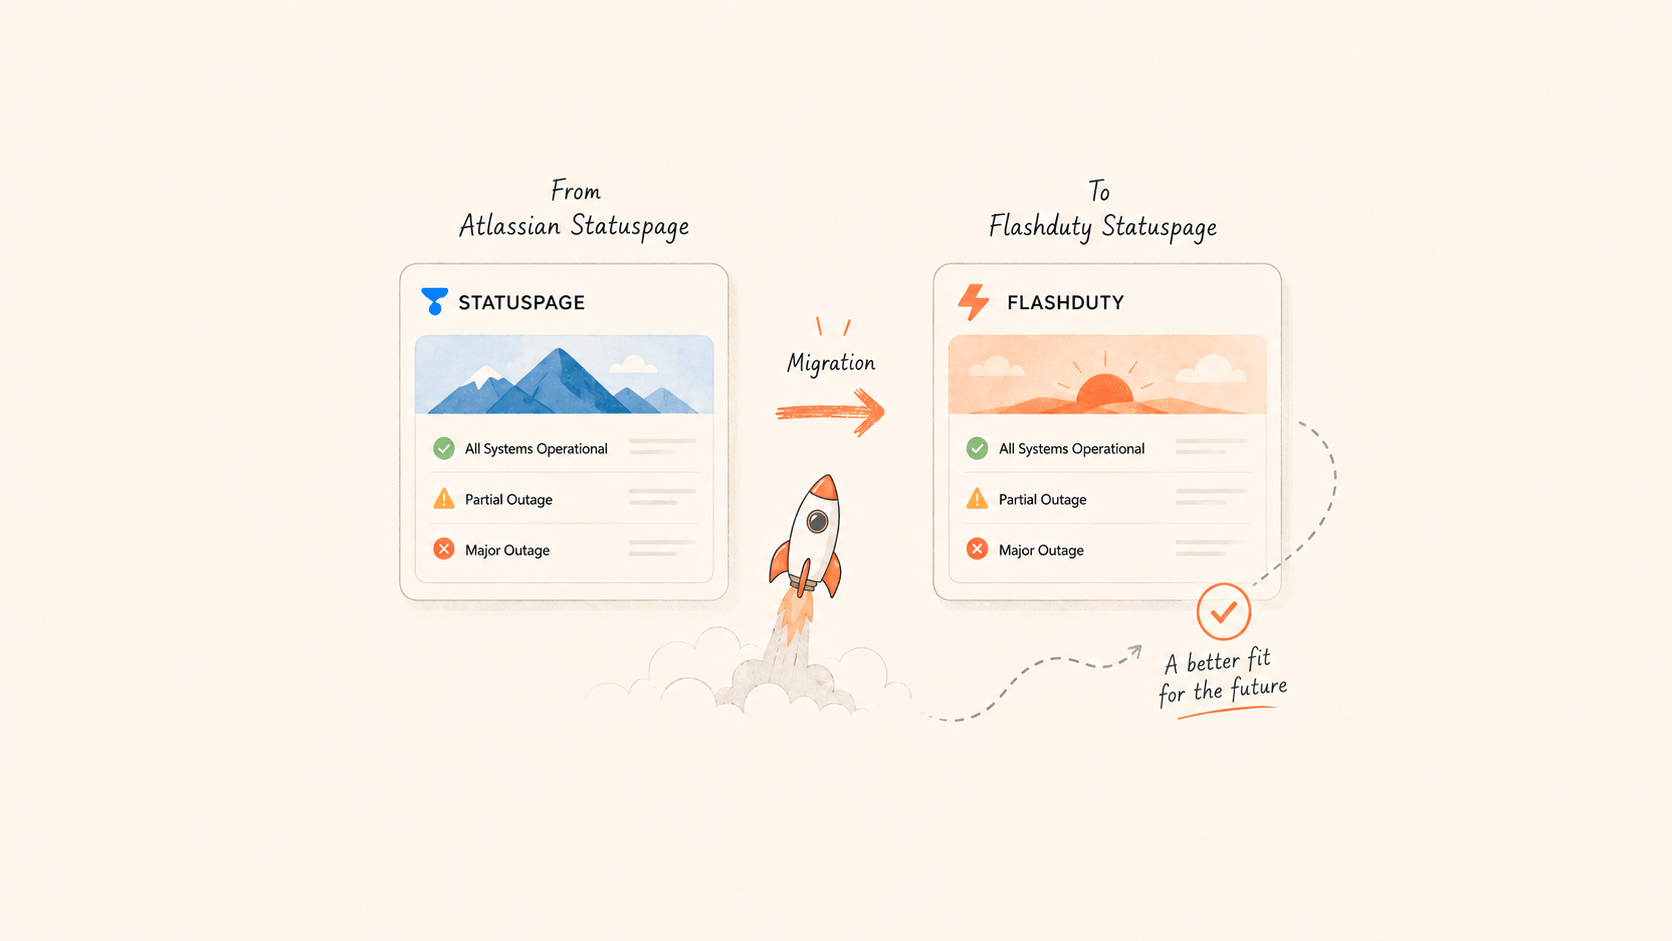
DeepSeek moved its public status page from Atlassian Statuspage to Flashduty Statuspage. The engineering math behind it: why they switched, whether to self-host, whether it migrates cleanly, and the key differences between Flashduty and Atlassian.

Flashduty Support

Read more
DeepSeek Status Page Migration: From Atlassian to Flashduty
  • Brand new Insights dashbord!

    The new insights dashboard is now live! Thank you for your patience.

    Improvement

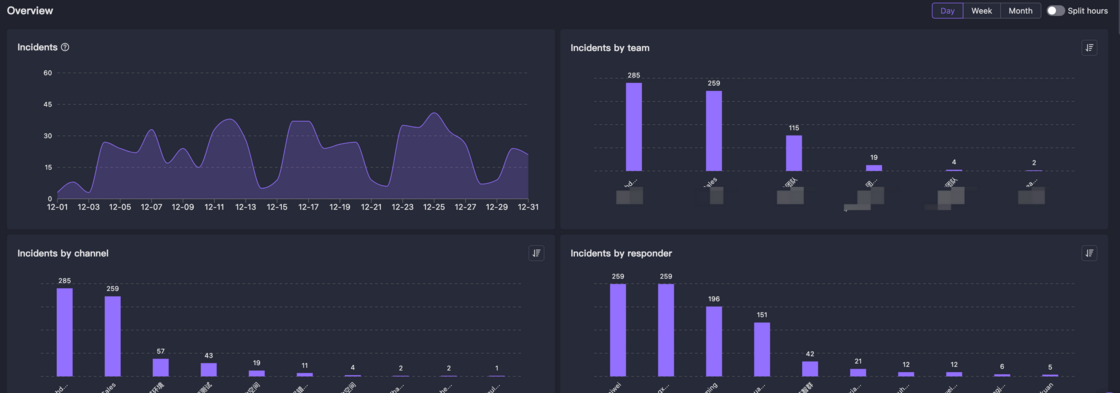
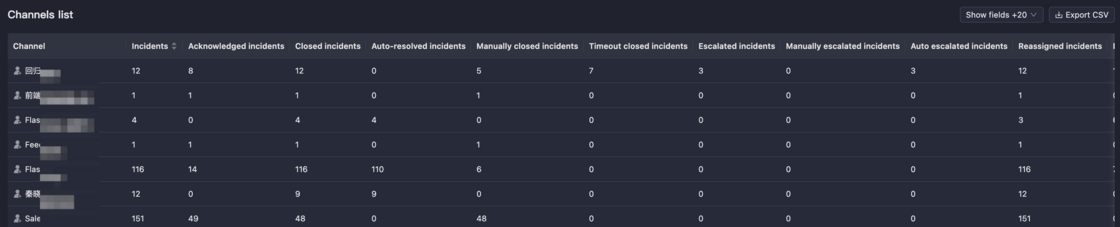
    Enhanced metric dimensions:

    Metric aggregation dimensions have been expanded from global and time-based views to include team, channel, and individual perspectives. This allows you to drill down from the global view into various sub-dimensions for metric analysis.

    image.png

    Time period segmentation:

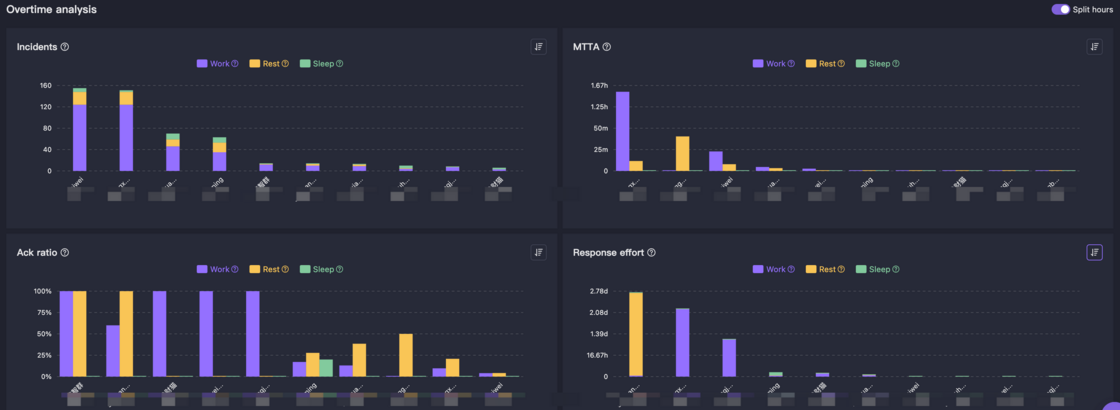
    For 24/7 on-call coverage, treating each hour equally is not fair. In this new version, we've divided time into three segments, allowing you to analyze metrics across these dimensions:

    • Work hours: Weekdays 8am~7pm
    • Rest hours: Weekdays 7pm11pm, Non-workdays 8am11pm
    • Sleep hours: Daily 11pm~8am
    image.png

    New workload metrics

    When tracking team incident handling workload, looking at incident and alert counts alone is insufficient. We now support interruptions and response effort metrics.

    • Interruptions: High-priority messages like SMS, phone calls, and app notifications are marked as interruptions, which can disrupt flow state and reduce team efficiency and satisfaction.
    • Response effort: The sum of time between incident acknowledgment and resolution. This metric roughly estimates time spent on incident response.
    image.png

    Report download and data export

    You can now print reports directly from the console for work summaries. Below each report, we provide detailed data that can be exported to CSV for further analysis.

    image.png
  • Upgrade for Incident Isolation

    Many users have reported that Flashduty's incident permission control was relatively weak. We have now made improvements to address this.

    Improvement

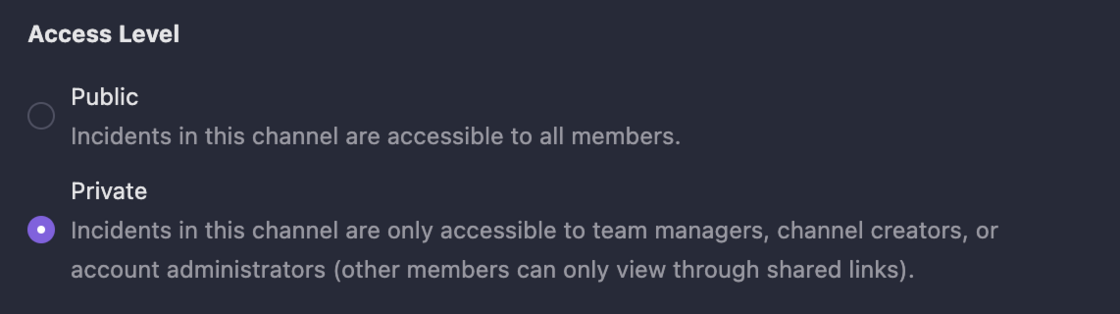
    1. Collaboration spaces now support access levels. When set to private, incident data is only accessible to team members and account administrators. Other members can only view incidents in private spaces through shared links.
    image.png
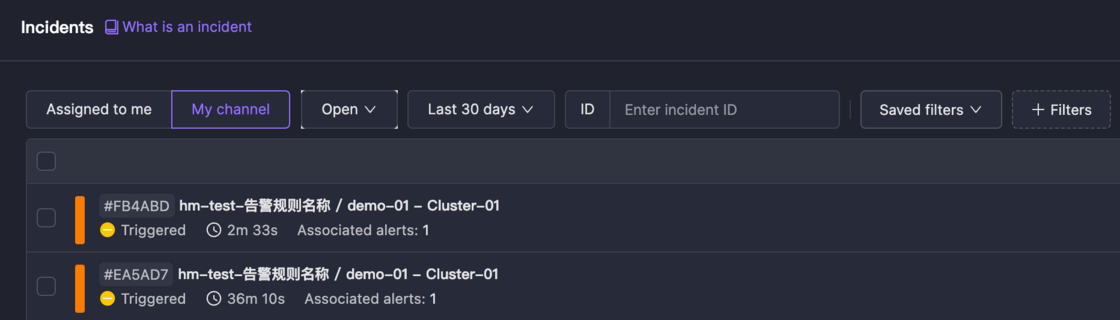
    1. The incident list now supports My Channels filtering. When selected, it only shows incidents from your spaces.
    image.png

    Best Practices for Data Isolation

    We believe platform data isolation has three levels, in descending order of strictness. Each level has recommended implementation methods:

    1. Personnel Isolation: For teams requiring separate personnel and encrypted information.

      Register multiple entities, with complete isolation of personnel and resources, managed separately.

    2. Resource Isolation: When you don't want other members to see or handle your incidents.

      Set channel access level to private, preventing other members from seeing this channel and its incidents. Note that account administrators still have access.

    3. Visual Experience: When you don't want to see alerts unrelated to you or your team.

      Keep the My Channels filter selected in the incident list. When you need to view all data, simply remove this filter.

    We look forward to your feedback!

  • Introducing the All-New Alert Pipeline!

    Many users have reported common issues with their internal alert configuration policies, such as missing alert information, numerous duplicate reports, and unclear severity levels. These problems have caused significant concerns for alert management personnel.

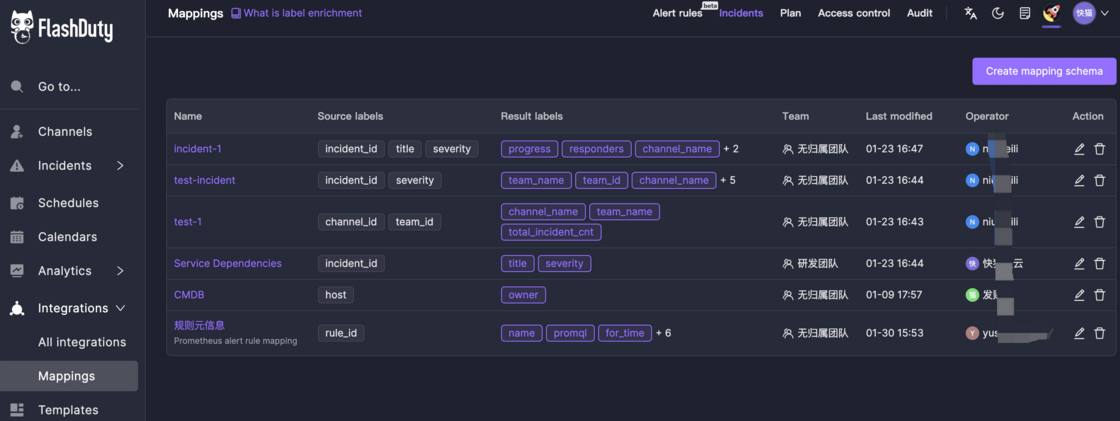
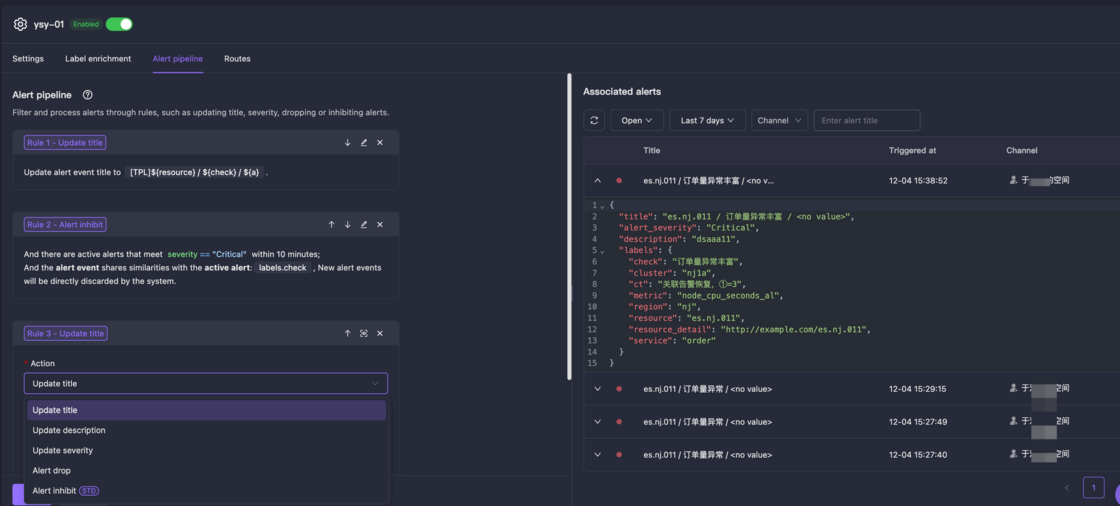
    Today, we are officially launching the Alert Pipeline along with comprehensive improvements to the integration experience. You can now easily implement multiple operations including severity reset, title modification, filtering, and CMDB integration. Properly configured alert processing rules not only enhance alert readability but also effectively reduce alert noise and improve problem identification efficiency.

    image.png

    Highlights:

    1. New Alert Pipeline: Supports various execution actions for more flexible and efficient alert handling.
    2. Improved Label Enrichment and Alert Routing Configuration: Added a new right-side alert history panel for more intuitive rule debugging.

    Try it out now!

  • Schdule Management Upgrade!

    We have comprehensively upgraded our on-call management system, with improvements in notifications, scheduling, and UI design.

    New

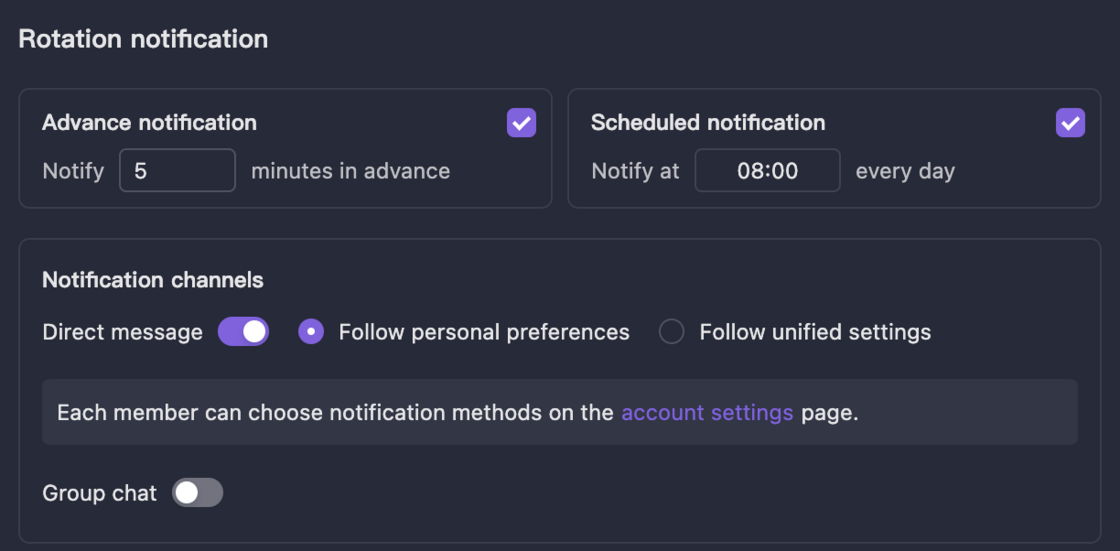
    1. Rotation notifications now support scheduled notifications, commonly used in scenarios where weekly on-call duties require daily reminders
    image.png
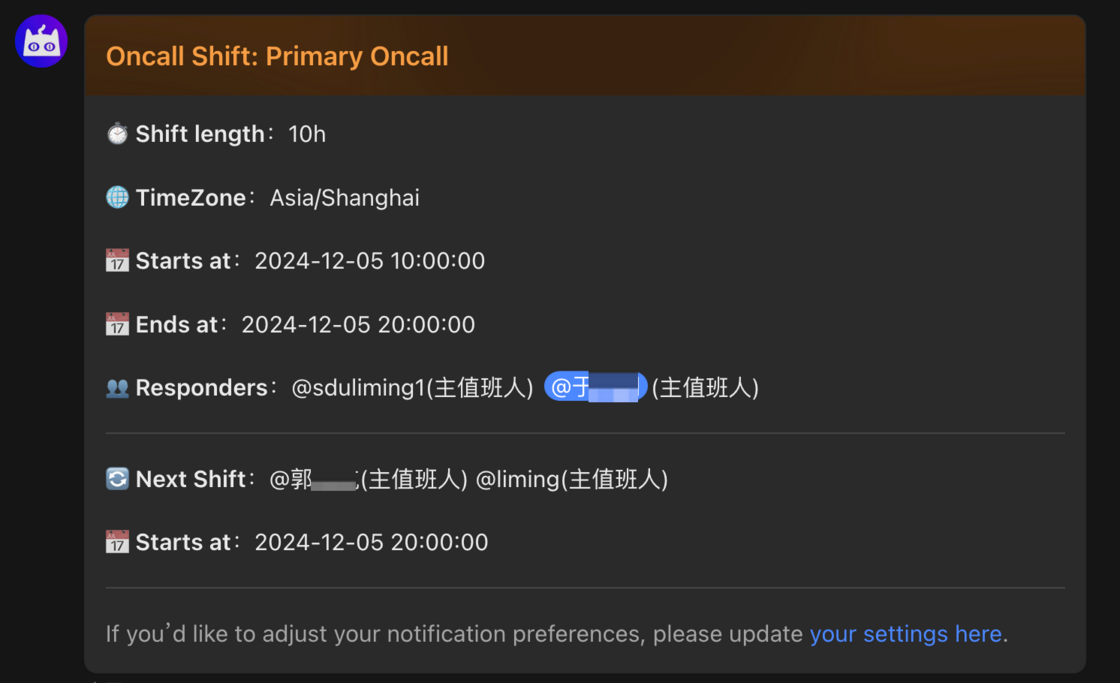
    1. Rotation notification content and style have been optimized to highlight current on-call information and show the next shift
    image.png
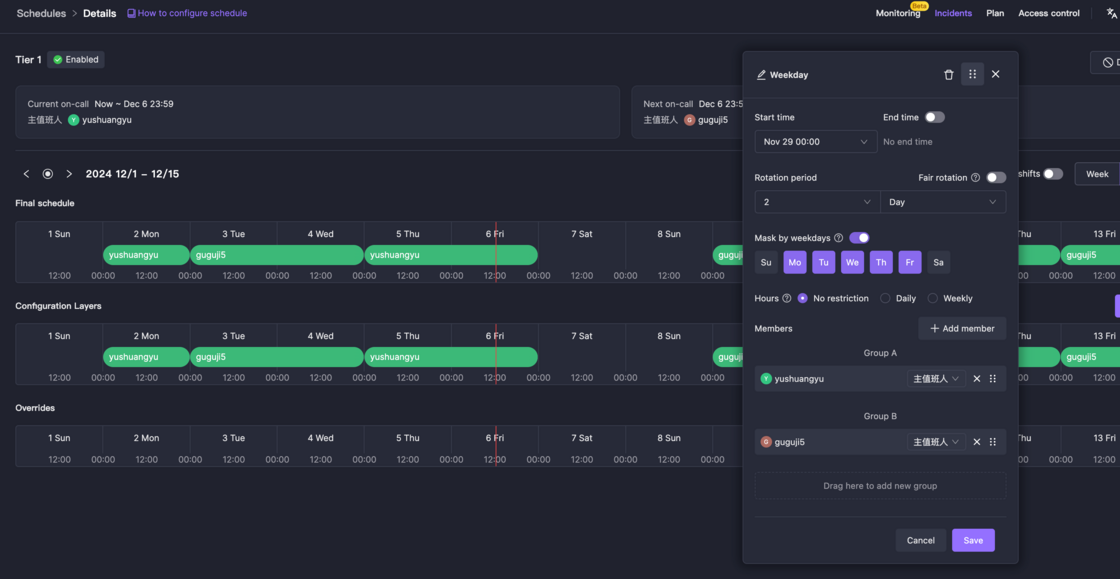
    1. Added date mask mode, where only selected dates participate in on-call duties, typically used for separate scheduling of weekday and weekend shifts
    image.png

    Improvement

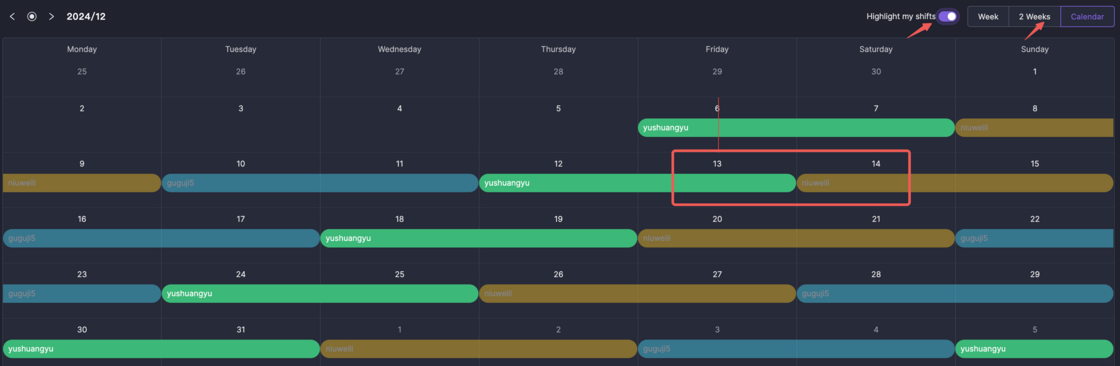
    1. On-call preview now includes a 2-week mode, similar to the 1-week view but showing more rotation information, especially useful for weekly on-call scenarios
    2. In the calendar view of on-call preview, colors now follow rotations instead of rules, making it easier to track rotation members by color
    3. Added highlight my on-call button to instantly highlight personal on-call schedules
    image.png
  • StateCloud and Guance integrations.

    1. Add alert integration for StateCloud
    image.png
    1. Add alert integration for Guance.
    image.png
  • English UI launch

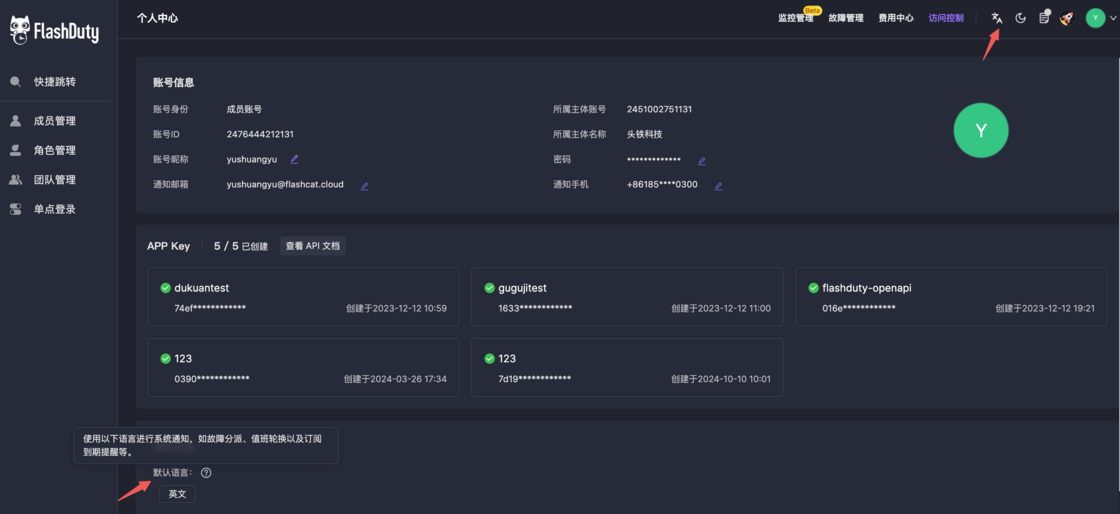
    We now offer full English support across the console, help docs, and developer documentation so more users can use the product without language barriers.

    What’s new

    1. Browser language
      Every member can switch the console display language and pick the experience that fits them.

    2. Notification language
      Account admins can set a default notification language under account settings. When incident notifications are sent, we render from your templates first; any content not covered by a template uses your notification language so messages stay consistent.

    English UI settings

    Try the new English experience today.

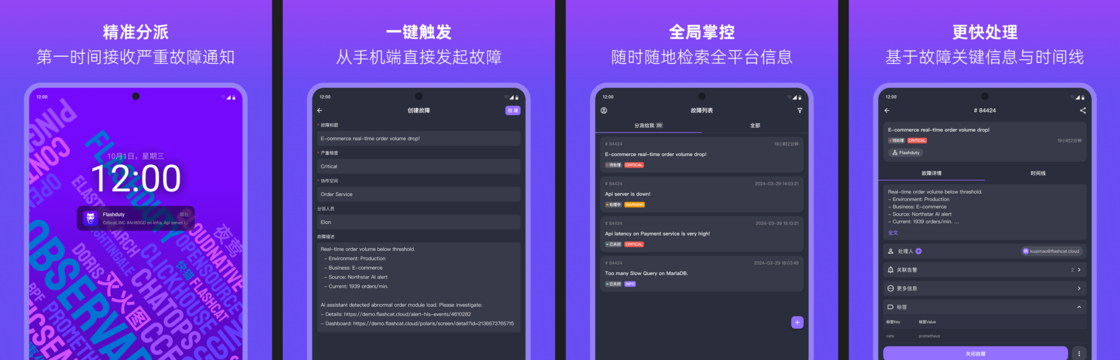
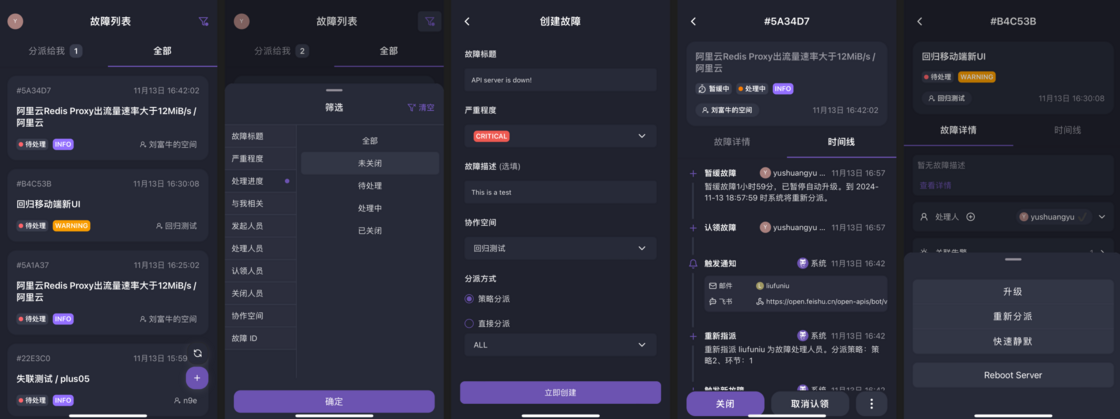
  • New mobile UI: sleeker and more powerful!

    1. Brand new UI/UX design
    2. Redesigned incident list with enhanced filtering options
    3. Revamped incident details page with quick actions and custom operations
    4. New incident creation feature with escalation rules and direct assignment
    5. New dark mode support
    image.png

    Try it now!

  • AIOps! Intelligent grouping, Rare and Past incidents.

    We've launched a series of AIOps capabilities. Try them out now!

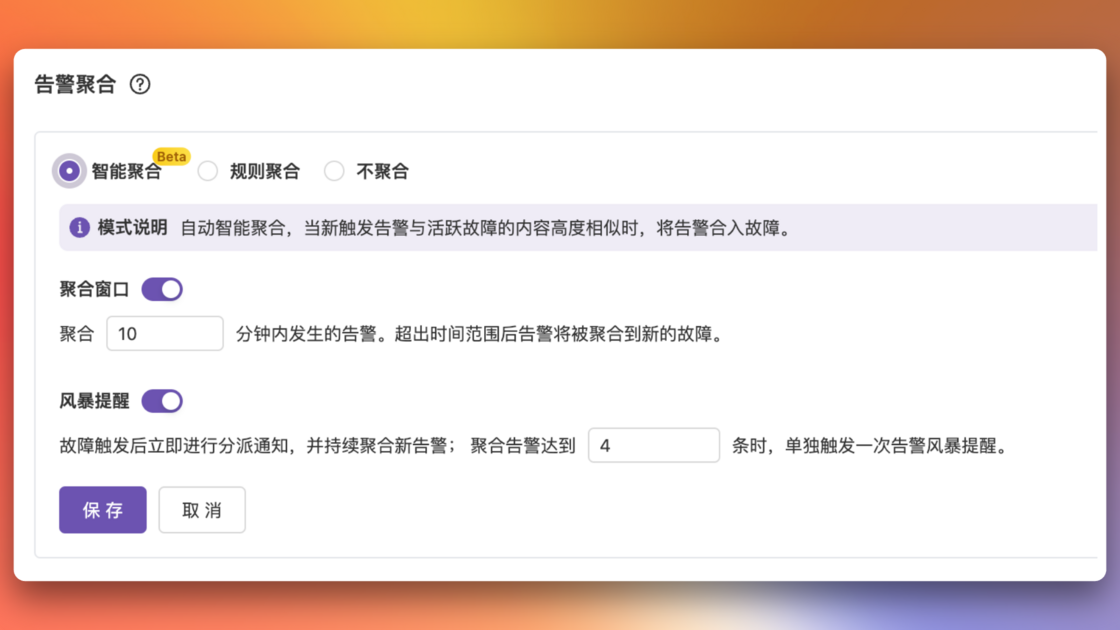
    Intelligent Grouping

    Introducing intelligent grouping mode for alerts. No manual rules needed - the system automatically identifies and groups similar alerts, reducing alert noise and helping you focus on critical events. Experience more efficient alert management and say goodbye to alert storms!

    3.png

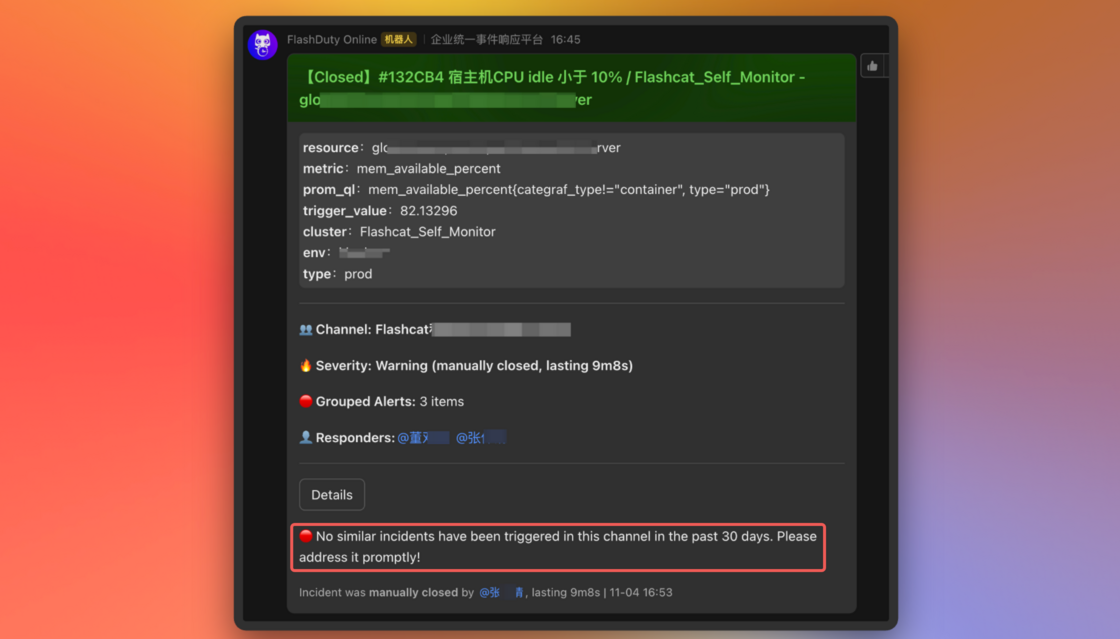
    Rare Incidents

    When a new incident doesn't match any incidents from the past 30 days in your channel, it's marked as a "Rare Incident." These incidents require extra attention as their system impact and resolution steps are unknown.

    image.png

    Past Incidents

    The past incidents feature shows you similar past incidents, helping with root cause analysis and resolution recommendations to speed up incident response. Leverage rich historical data for better problem-solving insights!

    2.png

    Note: These features are available in Pro version only. Contact us if you'd like to upgrade.

  • Breaking changes: Updates to inhibit and silence rules.

    Before Changes

    • Silence/inhibit rules were matched during incident notification, intercepting notifications if matched
    • Intercepted incidents generated interception records

    After Changes

    • Silence/inhibit rules are now matched during alert processing, preventing incident creation if matched
    • Intercepted alerts will not trigger or merge into incidents
    • You can choose to retain or drop intercepted alerts; retained alerts will generate interception records
    • Intercepted alerts can be filtered in the console

    Why This Change

    When an incident aggregates multiple alerts, its labels may differ from the original alerts. Matching silence/inhibit rules at the incident level caused these issues:

    1. Unwanted alerts couldn't be intercepted when merged into valid incidents
    2. Valid alerts had notifications blocked when merged into silenced/inhibited incidents
    3. When silence period ended, alerts belonging to an open silenced/inhibited incident still had notifications blocked
    4. Intercepted incidents couldn't be filtered as interception status changed over time

    Impact

    • ❌ If you have active silence/inhibit rules:
      • Intercepted alerts will be retained with silence/inhibit reasons recorded but won't generate incidents
    • ✅ If you have no active silence/inhibit rules:
      • No impact
  • September UI/UX improvements

    1. Added confirmation dialog for custom actions in console to prevent accidental high-risk operations
    2. New channels now appear at the top of the list
    3. Enhanced incident creation page:
      • Added escalation rule selection
      • Added Markdown support for description
      • Added hints for schedule and responder selection
    4. Added dynamic reset indicators in assignment history
    5. Added video tutorial links near core features
    6. Escalation rule updates:
      • Individual chat configurations now support empty channels for specific levels
      • Clarified loop notification text to avoid ambiguity
    7. Removed current responder from reassignment options
  • Meraki, OpManager and other integrations

    1. Added alert integration for Zabbix v7
    2. Added alert integration for InfluxData v2
    3. Added alert integration for Meraki
    4. Added alert integration for Zoho OpManager
    image.png
  • Solarwinds and Volcengine integrations

    1. Added alert integration for Solarwinds
    2. Added metric alert integration for Volcengine Cloud Monitor
    3. Added event alert integration for Volcengine Cloud Monitor
    4. Added alert integration for Volcengine Log Service
    image.png